

Question: For each situation below, determine which chart is appropriate and find the control chart limits. For variable measurements, you must find control limits for both
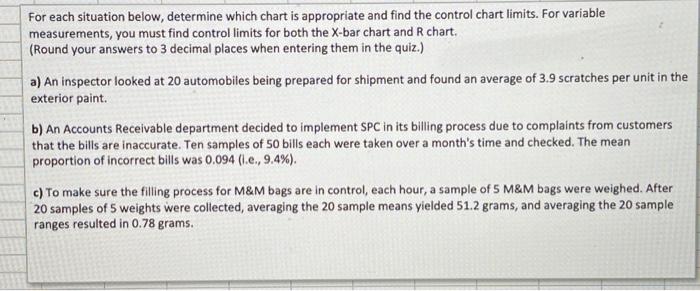
For each situation below, determine which chart is appropriate and find the control chart limits. For variable measurements, you must find control limits for both the X-bar chart and R chart. (Round your answers to 3 decimal places when entering them in the quiz.) a) An inspector looked at 20 automobiles being prepared for shipment and found an average of 3.9 scratches per unit in the exterior paint. b) An Accounts Receivable department decided to implement SPC in its billing process due to complaints from customers that the bills are inaccurate. Ten samples of 50 bills each were taken over a month's time and checked. The mean proportion of incorrect bills was 0.094 (i.e., 9.4%). c) To make sure the filling process for M\&M bags are in control, each hour, a sample of 5 M\&M bags were weighed. After 20 samples of 5 weights were collected, averaging the 20 sample means yielded 51.2 grams, and averaging the 20 sample ranges resulted in 0.78 grams
Step by Step Solution
There are 3 Steps involved in it

Get step-by-step solutions from verified subject matter experts