

Question: For each unknown, number the peaks in the spectrum from left to right. List the chemical shift (from the scale under the spectrum) and integral
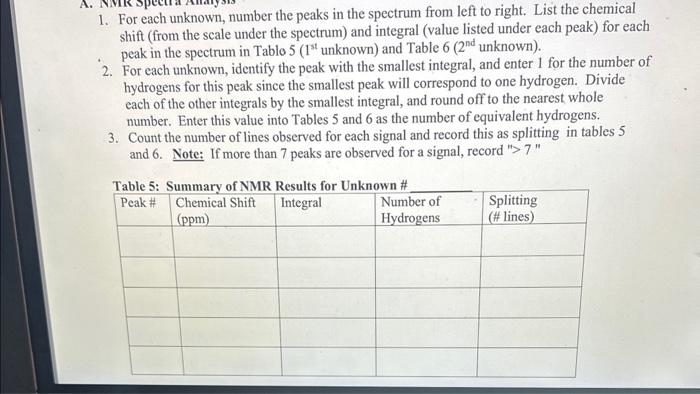
- For each unknown, number the peaks in the spectrum from left to right. List the chemical shift (from the scale under the spectrum) and integral (value listed under each peak) for each peak in the spectrum in Table 5 (1S unknown) and Table 6 (2nd unknown).
- For each unknown, identify the peak with the smallest integral, and enter 1 for the number of hydrogens for this peak since the smallest peak will correspond to one hydrogen. Divide each of the other integrals by the smallest integral, and round off to the nearest whole number. Enter this value into Tables 5 and 6 as the number of equivalent hydrogens.
- Count the number of lines observed for each signal and record this as splitting in tables 5 and 6. Note: If more than 7 peaks are observed for a signal, record "> 7 " and also fill out graph
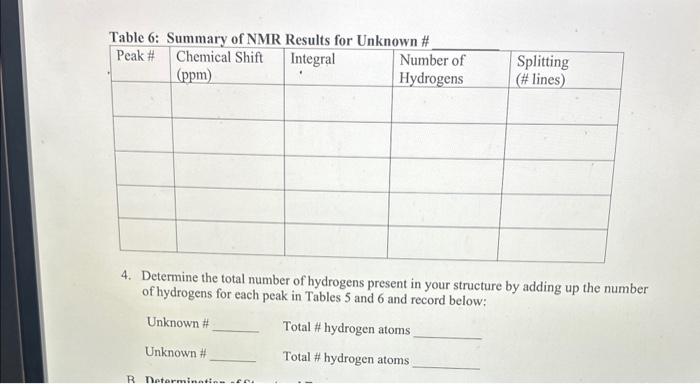
1. For each unknown, number the peaks in the spectrum from left to right. List the chemical shift (from the scale under the spectrum) and integral (value listed under each peak) for each peak in the spectrum in Tablo 5 ( 1st unknown) and Table 6 ( 2nd unknown). 2. For each unknown, identify the peak with the smallest integral, and enter 1 for the number of hydrogens for this peak since the smallest peak will correspond to one hydrogen. Divide each of the other integrals by the smallest integral, and round off to the nearest whole number. Enter this value into Tables 5 and 6 as the number of equivalent hydrogens. 3. Count the number of lines observed for each signal and record this as splitting in tables 5 and 6. Note: If more than 7 peaks are observed for a signal, record ">7" 4. Determine the total number of hydrogens present in your structure by adding up the number of hydrogens for each peak in Tables 5 and 6 and record below; Unknown \# Total \# hydrogen atoms Unknown \# Total \# hydrogen atoms IR Spectrum MW=110 IR Spectrum 1. For each unknown, number the peaks in the spectrum from left to right. List the chemical shift (from the scale under the spectrum) and integral (value listed under each peak) for each peak in the spectrum in Tablo 5 ( 1st unknown) and Table 6 ( 2nd unknown). 2. For each unknown, identify the peak with the smallest integral, and enter 1 for the number of hydrogens for this peak since the smallest peak will correspond to one hydrogen. Divide each of the other integrals by the smallest integral, and round off to the nearest whole number. Enter this value into Tables 5 and 6 as the number of equivalent hydrogens. 3. Count the number of lines observed for each signal and record this as splitting in tables 5 and 6. Note: If more than 7 peaks are observed for a signal, record ">7" 4. Determine the total number of hydrogens present in your structure by adding up the number of hydrogens for each peak in Tables 5 and 6 and record below; Unknown \# Total \# hydrogen atoms Unknown \# Total \# hydrogen atoms IR Spectrum MW=110 IR Spectrum
Step by Step Solution
There are 3 Steps involved in it

Get step-by-step solutions from verified subject matter experts