

Question: use the answer sheet to identify the unknown compound. Name Unknown Number a Infrared Spectrum From the Step by Step Analysis of Infrared Spectra, determine
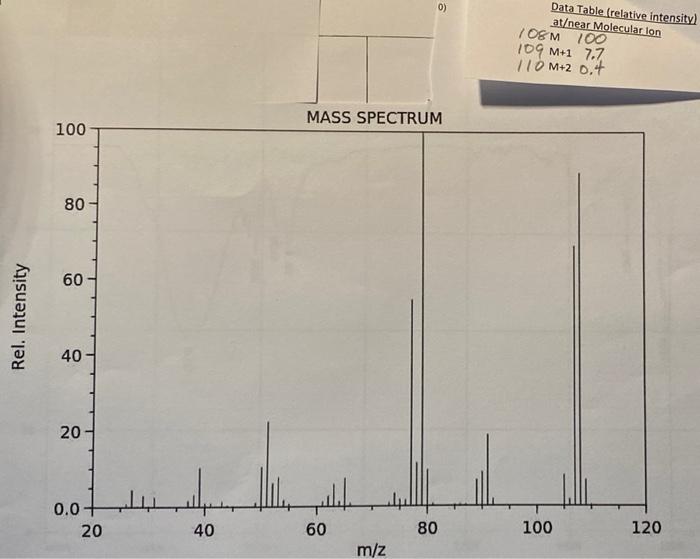
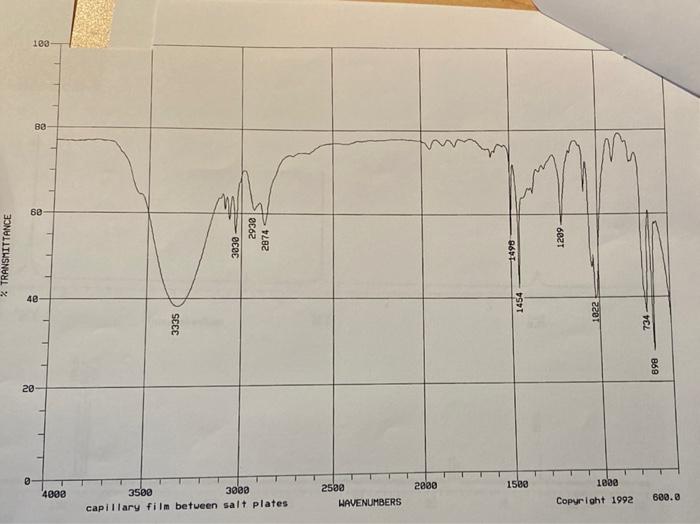
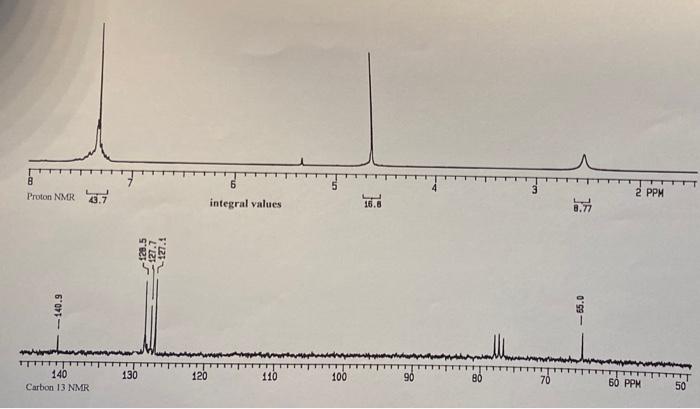
Name Unknown Number a Infrared Spectrum From the Step by Step Analysis of Infrared Spectra, determine the following: Appendix Ill verification (in cm? Question 1: Is there a carboxyl group (C=0)?Yor N) ja: a hydroxyl group (-OH)? 1b: an amide (-O=C-N-H or 0-C-NH.)? (which?) 1c-11: Indicate any positive results: -Question 2: phenol? ;-alcohol? 2a: -NH or-NH2 (which?) 2b: c(triple bond)C-H? -C(triple bond)N? 2c: -NO,2 2d: -R-O-R? Aromatic (benzene ring)? >3000 and 1450-1600 If so, substitution pattern (mono-.0-,m-p-, >2)? Mass Spectrum Molecular mass (M): #C(M+1): #N(M+1): HO(M+2) Clor Br? Evidence of any functional groups? What? Common (neutral) Mass Fragments Lost? What and mass? Observed, Very stable, Cations? What and mass? NMR Spectra How many C-13 spikes? What are their chemical shifts (ppm)? What might each chemical shift correspond to? How many proton peak sets? What are their chemical shifts (ppm)? What might each chemical shift correspond to? For each proton peak set, what is its relative number of protons compared to each other, based on numerical Integration values below each? Based on peak splitting, how many neighboring, equivalent protons are there for each peak set. Indicate whether there is one or more than one set of neighboring protons contributing to the splitting. Based on the information gleaned above, list possible molecules that fit the data collected above. If more than one, list in order of your estimation of its probability. If you can't be completely specific, use R., Rz, etc. as needed. Provide name and structure for each. 0) Data Table (relative intensity) atear Molecular lon / OEM 100 109 M+1 7.7 110 M+2 0.+ MASS SPECTRUM 100 80 60 Rel. Intensity 40 20 0.0 20 40 60 80 100 120 m/z 103 BO @9 2932 3030 2874 1299 % TRANSMITTANCE 1498 40 1454 1022 3335 734 898 20 2880 1580 4000 3500 3000 capillary film between salt plates 2588 HAVENUMBERS 1000 Copyright 1992 600.0 8 Proton NMR 7 3 2 PPM integral values 16.8 75 12.5 127.7 127.1 -- 140.9 - 55.0 TTT 140 Carbon 13 NMR 130 120 110 100 90 70 50 PPM
Step by Step Solution
There are 3 Steps involved in it

Get step-by-step solutions from verified subject matter experts