

Question: For Excel problem 16 complete the following process 1. In columns H and I of the spreadsheet calculating the median and mean of the statistical
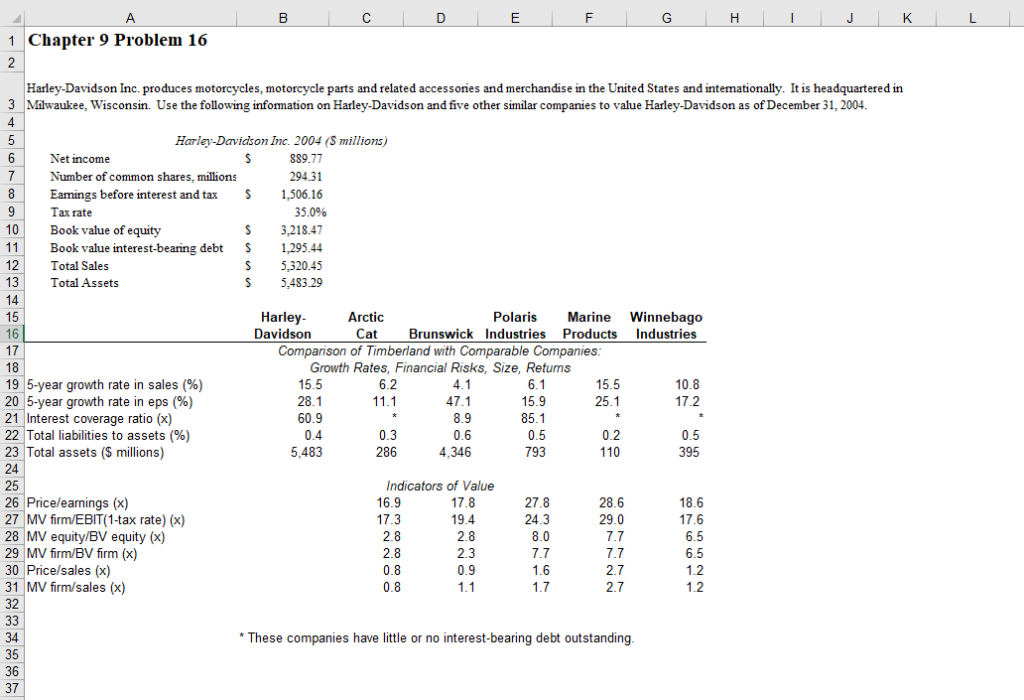
For Excel problem 16 complete the following process 1. In columns H and I of the spreadsheet calculating the median and mean of the statistical indicators for the five competitors to Harley Davidson. Exclude Harley Davidson's statistics from this analysis. Complete this analysis for both the operational (performance statistics) and value indicator metrics. 2. After calculating the Indicators of value median and mean for Harley's competitors estimate the appropriate value indicator for each metric to apply to Harley. In your analysis, consider Harley's performance in the operational statistics compared to the averages of their competitors. Explain based on this comparison, your selection of a value indicator metric to apply to Harley. 3. Develop a range of values for Harley's stock based on the selected value metric. Support and defend your value range 1 Chapter 9 Problem 16 Harley-Davidson Inc. produces motorcycles, motorcycle parts and related accessonies and merchandise in the United States and intemationally. It is headquartered in Milwaukee, Wisconsin. Use the following information on Harley-Davidson and five other similar companies to value Harley-Davidson as of December 31, 2004 3 Harley-Davidson Inc. 2004 (S millions) Net income 889.77 294.31 ,506.16 Number of common shares, millions 8 Eamings before interest and tax Tax rate 35096 3,218.47 11 Book value interest-bearing debt 1,295.44 S5,320.45 S 5483.29 10 Book value of equity 12 Total Sales 13 Total Assets 14 Harley Davidsorn Arctic Polaris Marine Winnebago Cat Brunswick Industries Products Industries Comparison of Timberland with Comparable Companies Growth Rates, Financial Risks, Size, Retums 15.5 25.1 10.8 17.2 195-year growth rate in sales (%) 2015-year growth rate in eps (%) 21 Interest coverage ratio (x) 22 Total liabilities to assets (%) 23 Total assets (S millions) 24 25 26 Price/earnings (x) 27 MV firm/EBIT 1-tax rate) (x) 28 MV equity/BV equity (x) 29 MV firm/BV firm (x) 30 Price/sales (x) 1 MV firm/sales (x) 32 15.5 28.1 60.9 6.2 11.1 6.1 15.9 85.1 0.5 793 47.1 0.3 286 0.6 4,346 0.2 110 0.5 395 5,483 Indicators of Value 16.9 27.8 24.3 8.0 7.7 28.6 29.0 7.7 7.7 2.7 2.7 2.8 2.8 0.8 0.8 17.8 19.4 2.8 2.3 0.9 18.6 17.6 6.5 1.7 1.2 34 35 36 37 These companies have little or no interest-bearing debt outstanding For Excel problem 16 complete the following process 1. In columns H and I of the spreadsheet calculating the median and mean of the statistical indicators for the five competitors to Harley Davidson. Exclude Harley Davidson's statistics from this analysis. Complete this analysis for both the operational (performance statistics) and value indicator metrics. 2. After calculating the Indicators of value median and mean for Harley's competitors estimate the appropriate value indicator for each metric to apply to Harley. In your analysis, consider Harley's performance in the operational statistics compared to the averages of their competitors. Explain based on this comparison, your selection of a value indicator metric to apply to Harley. 3. Develop a range of values for Harley's stock based on the selected value metric. Support and defend your value range 1 Chapter 9 Problem 16 Harley-Davidson Inc. produces motorcycles, motorcycle parts and related accessonies and merchandise in the United States and intemationally. It is headquartered in Milwaukee, Wisconsin. Use the following information on Harley-Davidson and five other similar companies to value Harley-Davidson as of December 31, 2004 3 Harley-Davidson Inc. 2004 (S millions) Net income 889.77 294.31 ,506.16 Number of common shares, millions 8 Eamings before interest and tax Tax rate 35096 3,218.47 11 Book value interest-bearing debt 1,295.44 S5,320.45 S 5483.29 10 Book value of equity 12 Total Sales 13 Total Assets 14 Harley Davidsorn Arctic Polaris Marine Winnebago Cat Brunswick Industries Products Industries Comparison of Timberland with Comparable Companies Growth Rates, Financial Risks, Size, Retums 15.5 25.1 10.8 17.2 195-year growth rate in sales (%) 2015-year growth rate in eps (%) 21 Interest coverage ratio (x) 22 Total liabilities to assets (%) 23 Total assets (S millions) 24 25 26 Price/earnings (x) 27 MV firm/EBIT 1-tax rate) (x) 28 MV equity/BV equity (x) 29 MV firm/BV firm (x) 30 Price/sales (x) 1 MV firm/sales (x) 32 15.5 28.1 60.9 6.2 11.1 6.1 15.9 85.1 0.5 793 47.1 0.3 286 0.6 4,346 0.2 110 0.5 395 5,483 Indicators of Value 16.9 27.8 24.3 8.0 7.7 28.6 29.0 7.7 7.7 2.7 2.7 2.8 2.8 0.8 0.8 17.8 19.4 2.8 2.3 0.9 18.6 17.6 6.5 1.7 1.2 34 35 36 37 These companies have little or no interest-bearing debt outstanding
Step by Step Solution
There are 3 Steps involved in it

Get step-by-step solutions from verified subject matter experts