

Question: For my stats class, got wrong answer, but prof didn't upload solutions. Any help is appreciated! Consider the three boxplots below. Each boxplot represents a
For my stats class, got wrong answer, but prof didn't upload solutions. Any help is appreciated!
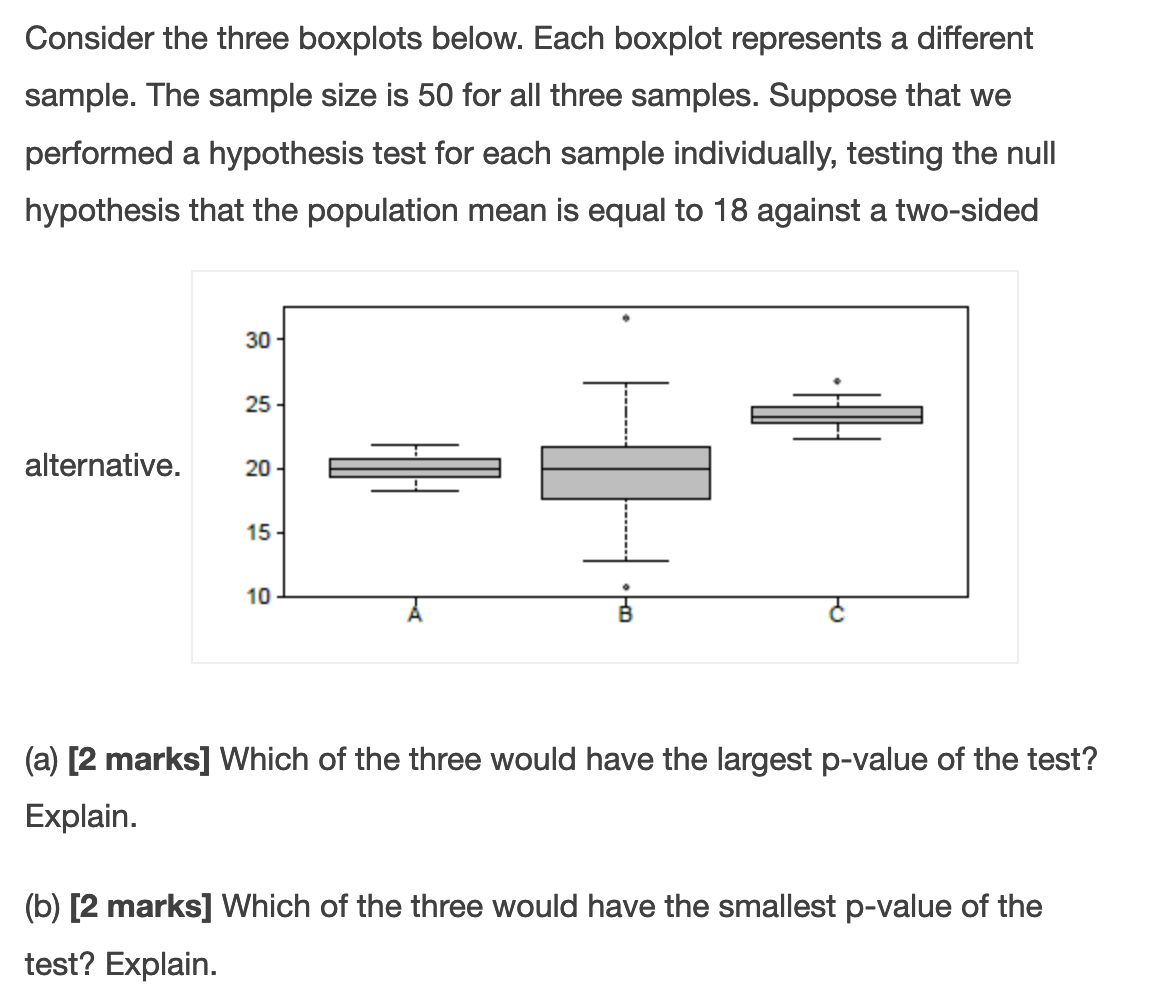
Consider the three boxplots below. Each boxplot represents a different sample. The sample size is 50 for all three samples. Suppose that we performed a hypothesis test for each sample individually, testing the null hypothesis that the population mean is equal to 18 against a two-sided alternative. (a) [2 marks] Which of the three would have the largest p-value of the test? Explain. (b) [2 marks] Which of the three would have the smallest p-value of the test? Explain
Step by Step Solution
There are 3 Steps involved in it
1 Expert Approved Answer
Step: 1 Unlock

Question Has Been Solved by an Expert!
Get step-by-step solutions from verified subject matter experts
Step: 2 Unlock
Step: 3 Unlock