

Figure 1 illustrates the X-ray Photoelectron Spectra of the Ti 2p lines for a sample of TiO
Fantastic news! We've Found the answer you've been seeking!
Question:
Figure 1 illustrates the X-ray Photoelectron Spectra of the Ti 2p lines for a sample of TiO2. The Binding Energy for the 2p3/2line is at 458.9 eV.
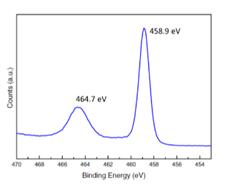
- Explain, using appropriate diagrams, how the photoelectrons are generated in X-ray Photoelectron Spectra.
- Giving your reasoning, state how the positions and relative intensities of the Ti 2p line would change if the spectra were of Ti metal rather than TiO2.
- What is the origin of the second line at 464.7 eV?
Expert Answer:
Solution 1 Xray Photoelectron SpectroscopyXPS is a photoelectric effect based quantitative spe... View the full answer

Related Book For 

Statistics The Art and Science of Learning from Data
ISBN: 978-0321755940
3rd edition
Authors: Alan Agresti, Christine A. Franklin
Posted Date:
