

For numbers 39-51, identify the appropriate formula and calculate the following ratios for 2015 and 2014 **AND
Question:
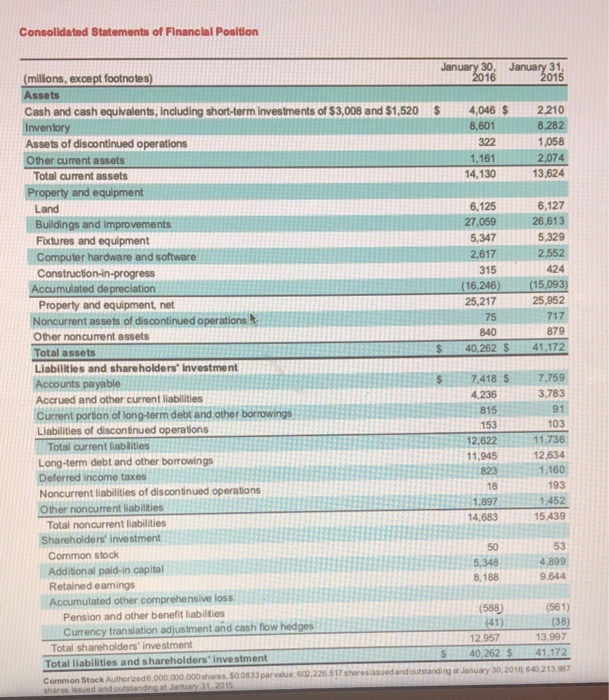
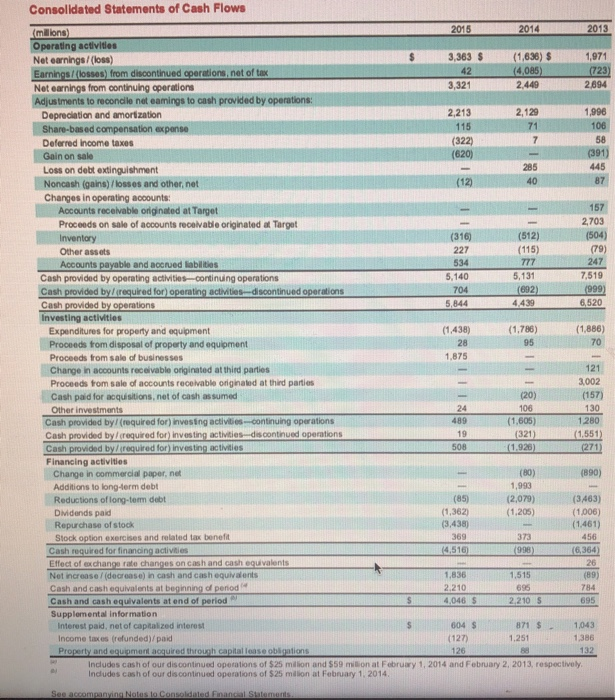
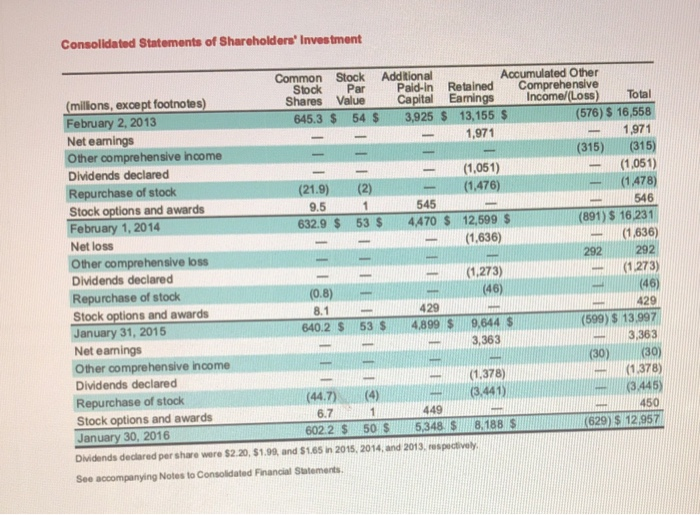
For numbers 39-51, identify the appropriate formula and calculate the following ratios for 2015 and 2014 **AND analyze the results Using Target 10K Annual Report. (Market performance ratios (earnings per share, book value per share, price-earnings ratio, and dividend yield are already computed and included in the template.) You will need to use the 2014 reports in order to calculate averages where applicable.
Measures of liquidity (15 pts) 39. Working capital
40. Current ratio
41. Quick ratio
42. Inventory turnover
43. Average days to sell inventory
Measures of solvency (15 pts)
44. Debt to assets
45. Debt to equity
46. Number of times interest earned
47. Plant assets to long-term liabilities
Measures of profitability (15 pts)+5
48. Net margin (return on sales)
49. Asset turnover
50. Return on investment
51. Return on equity
Section 4 ? Budgeting (25 points)?
1. Calculate the percentage change for each of the following categories of revenues and expenses for FY 2010 through FY 2014.
2. Calculate the average percentage change
3. Use the FY 2014 data and the average percentage change calculated in 2 to prepare a budget for FY 2015
4. Compare actual amounts from FY 2015 to the budget
Prepare an analytic report on your findings in Sections 2 ? 4.
 ?
?
Expert Answer:
ANSWER 43 Average days to sell inventory cannot be calculated without inventory turnover details Mea... View the full answer


Fundamentals of Electric Circuits
ISBN: 9780073301150
3rd edition
Authors: Matthew Sadiku, Charles Alexander
