

Question: For Option #2, you will be representing a map by a graph and finding the coloring of the graph that uses the fewest number of
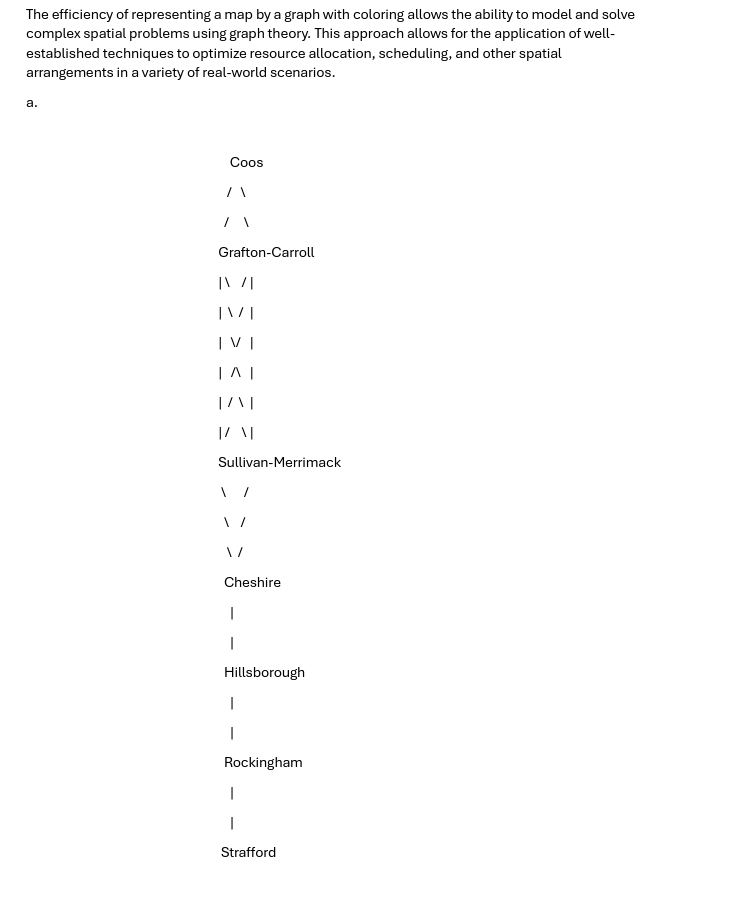
For Option #2, you will be representing a map by a graph and finding the coloring of the graph that uses the fewest number of colors. Complete the following tasks: Part 1: a. Find the county map of New Hampshire and create a graph that represents it. Counties should be represented as the vertices and the edges should be drawn between them when two counties share a border. b. Determine if your graph is 2-colorable, 3-colorable, or 4-colorable. . Discuss how you found your answer to part (b) and what real-world applications there might be for your findings. Part 2: a. Draw a map of a fictional state consisting of four counties that is 3-colorable. b. Discuss your method for creating the map in part (a). Be sure to explain how you verified that your map is indeed 3-colorable. The efficiency of representing a map by a graph with coloring allows the ability to model and solve complex spatial problems using graph theory. This approach allows for the application of well- established techniques to optimize resource allocation, scheduling, and other spatial arrangements in a variety of real-world scenarios. a. Coos Grafton-Carroll IVI IAI Sullivan-Merrimack Cheshire - - Hillsborough Rockingham Strafford
Step by Step Solution
There are 3 Steps involved in it

Get step-by-step solutions from verified subject matter experts