

Question: For Problems 10 through 12: Consider historical data showing that the average annual rate of return on the S&P 500 portfolio over the past 95
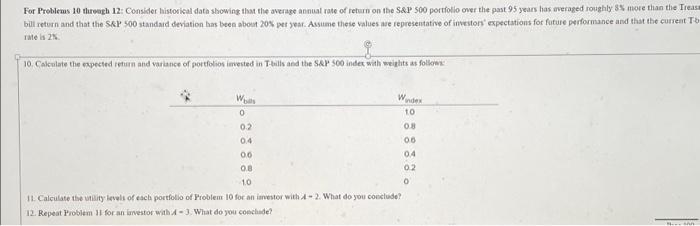
For Problems 10 through 12: Consider historical data showing that the average annual rate of return on the S&P 500 portfolio over the past 95 years has averaged roughly 8% more than the Treas bill return and that the S&P 500 standard deviation has been about 20% per year. Assume these values are representative of investors' expectations for future performance and that the current T-b rate is 2%. 10. Calculate the expected return and variance of portfolios invested in T-bills and the S&P 500 index with weights as follows: W bills O 0.2 0.4 0.6 0.8 1.0 Windex 1.0 0.8 0.6 0.4 0.2 O 11. Calculate the utility levels of each portfolio of Problem 10 for an investor with A- 2. What do you conclude? 12. Repeat Problem 11 for an investor with A- 3. What do you conclude? Ross 100
For Problems 10 threagh 12: Consiter historical dath showing that the average annual rate of return on the S\&P 500 portfollo over the past 95 years has averaged roughly 85 more than the Treas bill return and that the SkP 400 standaid deviation bas bees about 205 per jest. Assume these values ase representative of investors' expectations for future performance and that the curseat T rate is 2s 11. Calculate the visisy levals of esch portfotio of Problem 10 for an imestor with A2. What do you coestude? 12. Repeat Problem 31 for an investor with A - 3. What do you coschise
Step by Step Solution
There are 3 Steps involved in it
1 Expert Approved Answer
Step: 1 Unlock

Question Has Been Solved by an Expert!
Get step-by-step solutions from verified subject matter experts
Step: 2 Unlock
Step: 3 Unlock