

Question: just question 10 For Problems 10 through 12: Consider historical data showing that the average annual rate of return on the S&P 500 portfolio over
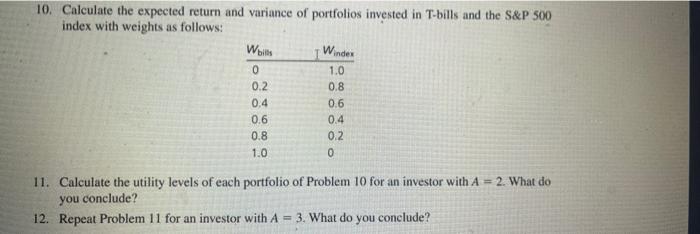
For Problems 10 through 12: Consider historical data showing that the average annual rate of return on the S&P 500 portfolio over the past 85 years has averaged roughly 8% more than the Treasury bill return and that the S&P 500 standard deviation has been about 20% per year. Assume these values are representative of investors' expec- tations for future performance and that the current T-bill rate is 5%. 1 10. Calculate the expected return and variance of portfolios invested in T-bills and the S&P 500 index with weights as follows: Woits Windes 0 0.2 0.4 0.6 0.8 1.0 1.0 0.8 0.6 0.4 0.2 0 11. Calculate the utility levels of each portfolio of Problem 10 for an investor with A = 2. What do you conclude? 12. Repeat Problem 11 for an investor with A = 3. What do you conclude
Step by Step Solution
There are 3 Steps involved in it

Get step-by-step solutions from verified subject matter experts