

Question: For python 3.4 So far I have from graphics import * def main(): inFile = open(numbers.txt,'r') for i in range(5): data = inFile.readline() # draw
For python 3.4
So far I have
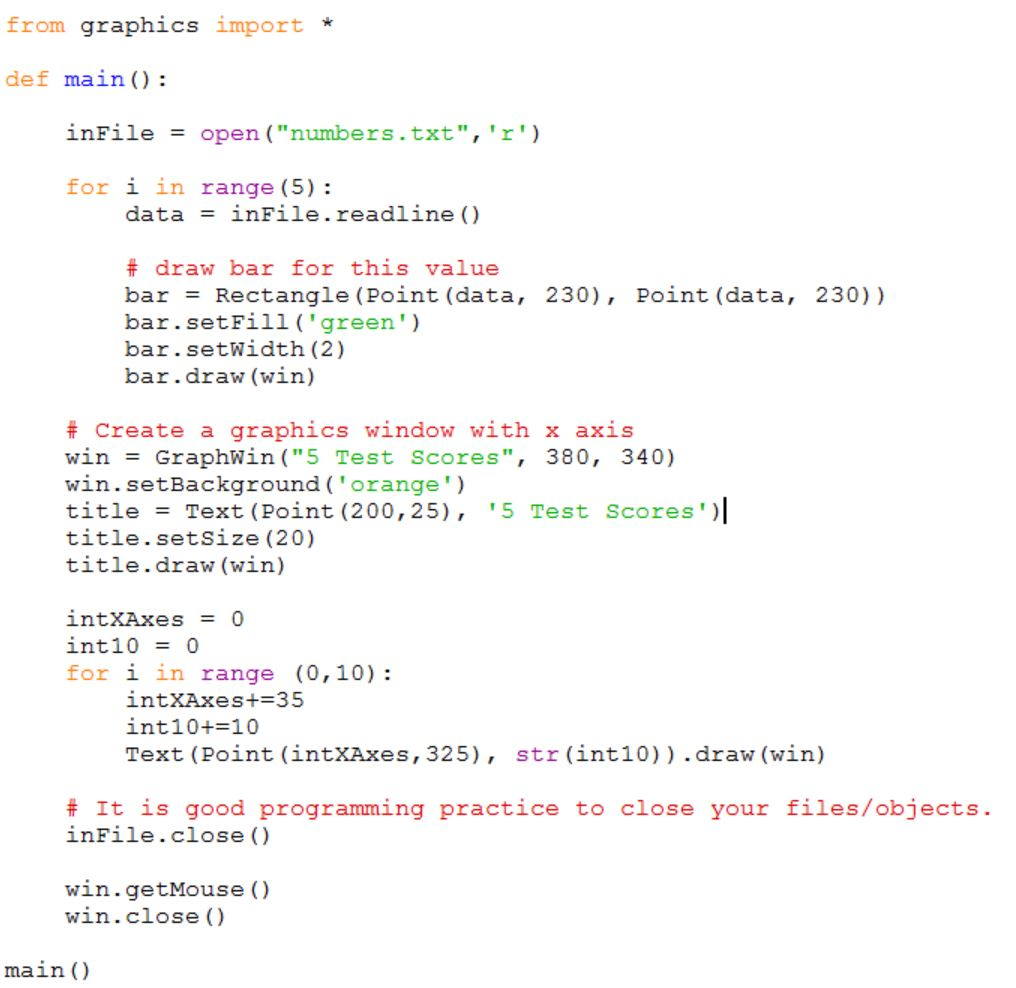
from graphics import *
def main(): inFile = open("numbers.txt",'r')
for i in range(5): data = inFile.readline() # draw bar for this value bar = Rectangle(Point(data, 230), Point(data, 230)) bar.setFill('green') bar.setWidth(2) bar.draw(win)
# Create a graphics window with x axis win = GraphWin("5 Test Scores", 380, 340) win.setBackground('orange') title = Text(Point(200,25), '5 Test Scores') title.setSize(20) title.draw(win) intXAxes = 0 int10 = 0 for i in range (0,10): intXAxes+=35 int10+=10 Text(Point(intXAxes,325), str(int10)).draw(win)
# It is good programming practice to close your files/objects. inFile.close()
win.getMouse() win.close()
main()
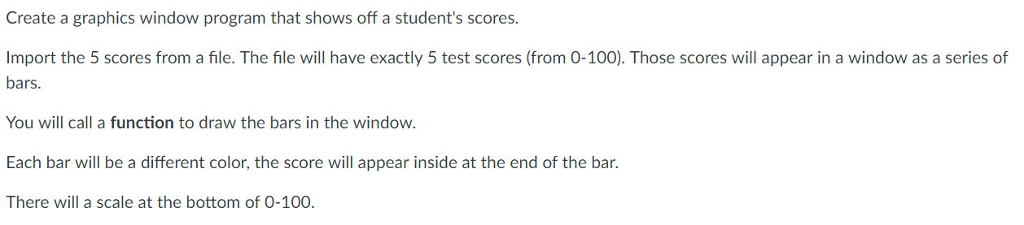
Create a graphics window program that shows off a student's scores. Import the 5 scores from a file. The file will have exactly 5 test scores (from 0-100). Those scores will appear in a window as a series of bars. You will call a function to draw the bars in the window Each bar will be a different color, the score will appear inside at the end of the bar. There will a scale at the bottom of 0-100
Step by Step Solution
There are 3 Steps involved in it

Get step-by-step solutions from verified subject matter experts