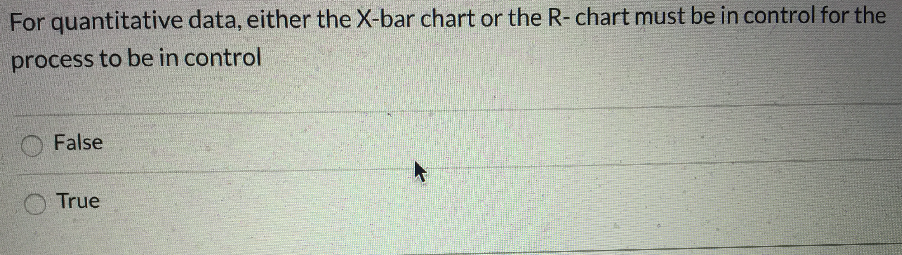
Question: For quantitative data, either the X-bar chart or the R-chart must be in control for the process to be in control False True The Neapolitan

For quantitative data, either the X-bar chart orFor quantitative data, either the X-bar chart orFor quantitative data, either the X-bar chart orFor quantitative data, either the X-bar chart or

For quantitative data, either the X-bar chart or the R-chart must be in control for the process to be in control False True The Neapolitan Book Company (NBC) requires 5,000 yards of paper per year. The cost per order is $100; the cost of holding 1 yard of paper in inventory is $1 per year. Assuming 360 days in a year, compute the order cycle time. None of the above 5 072 360 Cracko Chocolatiers craft choice candy for Halloween. Each 'Boo Boo' box costs $16 and sells for $22. After Halloween, each box is on sale for $10. Past demand is characterized by a normal distribution with a mean of 200 units and a standard deviation of 50 units. Compute the optimal order size. Compute the overall reliability for the system represented below (the options provided below are rounded to 2 decimal places): 0.6 0.6 0.8 0.8 0.2 0.2

Step by Step Solution

There are 3 Steps involved in it

1 Expert Approved Answer
Step: 1 Unlock blur-text-image
Question Has Been Solved by an Expert!

Get step-by-step solutions from verified subject matter experts

Step: 2 Unlock
Step: 3 Unlock

Students Have Also Explored These Related General Management Questions!