

Question: i think i supposed to use the statistical calculations from the first part. Not sure how to start X fx B D E F G
i think i supposed to use the statistical calculations from the first part. Not sure how to start 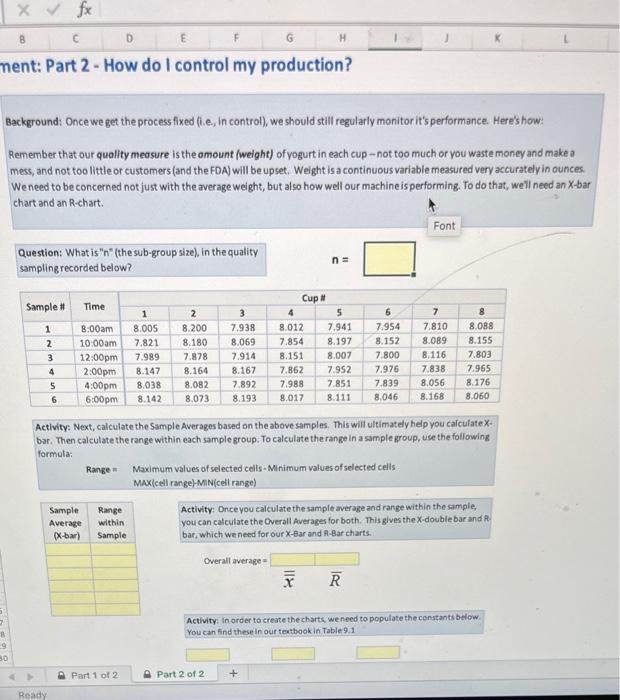
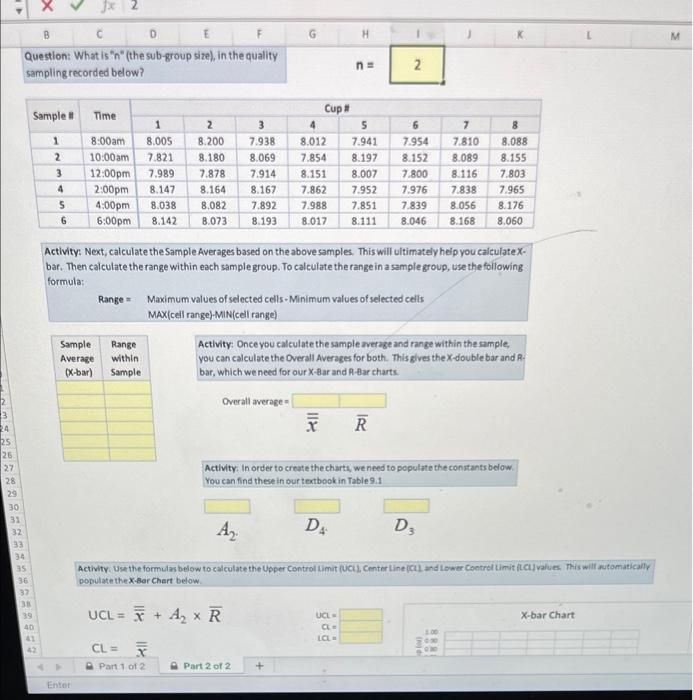
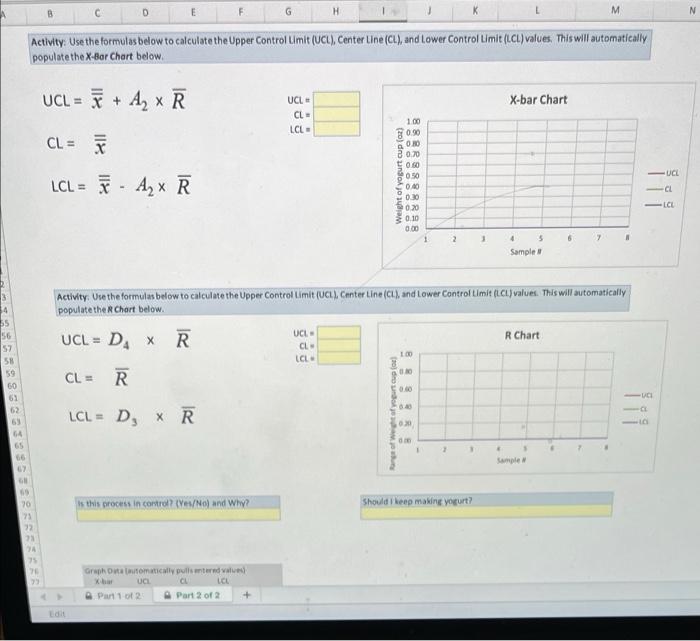
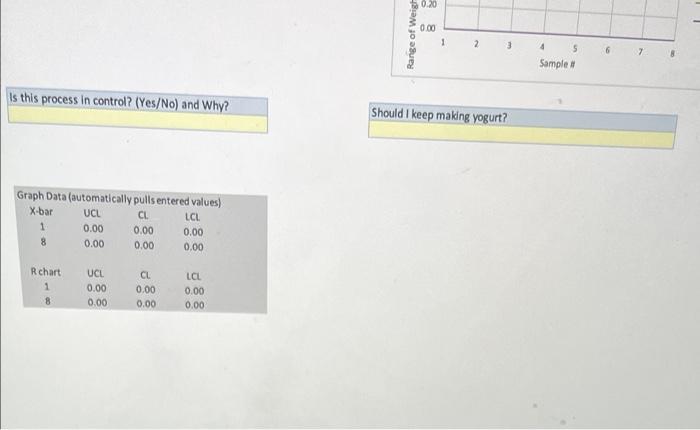
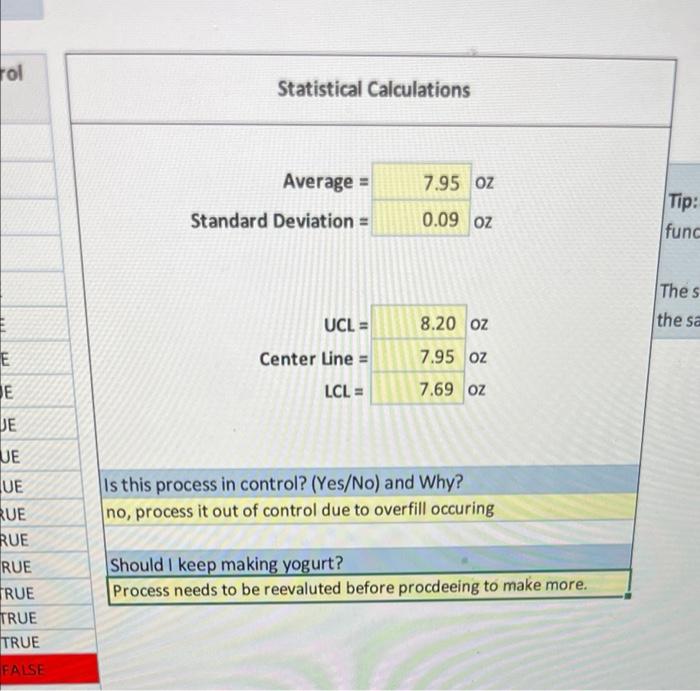
X fx B D E F G H ment: Part 2 - How do I control my production? Background: Once we get the process fixed (ie. In control), we should still regularly monitor it's performance. Here's how: Remember that our quality measure is the amount (weight) of yogurt in each cup-not too much or you waste money and make a mess, and not too little or customers (and the FDA) will be upset. Weight is a continuous variable measured very accurately in ounces. We need to be concerned not just with the average weight, but also how well our machine is performing. To do that, we'll need an X-bar chart and an R-chart. Font Question: What is "n" (the sub-group size), in the quality sampling recorded below? n = Sample # Time WN 1 2 3 4 5 6 8:00am 10:00am 12:00pm 2:00pm 4:00pm 6:00pm 1 8.005 7.821 7.989 8.147 8.038 8.142 2 8.200 8.180 7.878 8.164 8.082 8.073 3 7.938 8.069 7.914 8.167 7.892 8.193 Cup 4 8.012 7.854 8.151 7.862 7.988 8.017 5 7.941 8.197 8.007 7.952 7.851 8.111 6 7.954 8.152 7.800 7.976 7.839 8.046 7 7.810 8.089 8.116 7.838 8.056 8.168 8 8.088 8.155 7.803 7.965 8.176 8.060 Activity: Next, calculate the Sample Averages based on the above samples. This will ultimately help you calculate X. bar. Then calculate the range within each sample group. To calculate the range in a sample group, use the following formula: Range Maximum values of selected cells - Minimum values of selected cells MAX(cell range)-MiNcell range) Sample Range Activity: Once you calculate the sample average and range within the sample, Average within you can calculate the Overall Averages for both. This gives the X-double bar and X-bar) Sample bar, which we need for our X-Bar and R-Bar charts. Overall average- Activity: In order to create the charts, we need to populate the constants below You can find these in our textbook in Table 9.1 3 9 30 Part 1 of 2 Part 2 of 2 + Ready B G H C D Question: What is "n" (the sub-group size), in the quality sampling recorded below? nu 2 Sample # Time 1 8:00 am 2 10:00am 3 12.00pm 4 2:00pm 4:00pm 6 6:00pm 8.005 7.821 7.989 8.147 8.038 8.142 2 8.200 8.180 7.878 8.164 8.082 8.073 3 7.938 8.069 7.914 8.167 7.892 8.193 Cup # 4 5 8.012 7.941 7.854 8.197 8.151 8.007 7.862 7.952 7.988 7.851 8.017 8.111 6 7.954 8.152 7.800 7.976 7.839 8.046 7 7.810 8.089 8.116 7.838 8.056 8.168 8 8.088 8.155 7.803 7.965 8.176 8.060 S Activity: Next, calculate the Sample Averages based on the above samples. This will ultimately help you calculatex- bar. Then calculate the range within each sample group. To calculate the range in a sample group, use the following formula: Range Maximum values of selected cells- Minimum values of selected cells MAX(cell range)-MINcell range) Sample Range Activity: Once you calculate the sample average and range within the sample, Average within you can calculate the Overall Averages for both. This gives the X-double bar and R. (X-bar) Sample bar, which we need for our X-Bar and R-Bar charts Overall average- Activity: In order to create the charts, we need to populate the constants below. You can find these in our textbook in Table 9.1 Az DA 24 25 26 27 28 29 30 31 32 33 34 35 36 37 30 39 40 41 42 Ds Activity. Use the formules below to calculate the Upper Control Limit (UCL, Center Line (Cand lower Controllimit values. This will automatically populate the X-Bar Chart below X-bar Chart UCL = F + A, R CL= UCLE CLE LCL Part 1 of 2 A Part 2 of 2 + Enter B D G H K L M N Activity: Use the formulas below to calculate the Upper Control Limit (UCL), Center Line (CL), and lower Control Limit (LCL) values. This will automatically populate the X-Bar Chart below UCL = + A X-bar Chart UCL CL LCL 1.00 090 CL= 0.80 0.70 00 0.50 Weight of yogurt cup (2) UCL LCL = F - Ayx R Az CL 0.00 030 10.30 0.10 0.00 LCL 2 1 6 7 4 5 Sample 55 56 57 58 59 60 63 62 69 64 65 Activity Use the formulas below to calculate the Upper Control Limit (UCI), Center Line (C1), and Lower Controllimit (LL) values. This will automatically populate the Chart below. UCL R Chart UCL = R Da x CL LCL CL = R 10 UCI odnosa LCLE D, R 02 67 Is this process in control (Ves/No) and Why? Should keep making yogurt? 9 90 73 32 23 74 35 TE 73 Graph outomatically pulls entered value UCH CL LCL Part 1 of 2 Part 2 of 2 0.20 Range of Weight 0.00 1 3 6 7 4 5 Sample Is this process in control? (Yes/No) and Why? Should I keep making yogurt? Graph Data (automatically pulls entered values) X-bar UCL CL LCL 1 0.00 0.00 0.00 8 0.00 0.00 0.00 Rchart 1 8 UCL 0.00 0.00 CL 0.00 0.00 LCL 0.00 0.00 Tol Statistical Calculations Average = 7.95 OZ Standard Deviation = 0.09 OZ Tip: func Thes the sa 8.20 OZ UCL = Center Line = E 7.95 OZ JE LCL= 7.69 OZ DE Is this process in control? (Yes/No) and Why? no, process it out of control due to overfill occuring UE UE RUE RUE RUE TRUE TRUE TRUE Should I keep making yogurt? Process needs to be reevaluted before procdeeing to make more. FALSE Step by Step Solution
There are 3 Steps involved in it
1 Expert Approved Answer
Step: 1 Unlock

Question Has Been Solved by an Expert!
Get step-by-step solutions from verified subject matter experts
Step: 2 Unlock
Step: 3 Unlock