

Question: For question 1-2 use the following data: (picture) 1. Which of these is the equation of the regression line?A. Mus.Apt.= .4925-22.26 (IQ Score)B. IQ Score=
For question 1-2 use the following data: (picture) 1. Which of these is the equation of the regression line?A. Mus.Apt.= .4925-22.26 (IQ Score)B. IQ Score= -22.26+.4925(Mus.Apt.)C. IQ score= constant + .4925xD. Mus.Apt. = -22.26 + .4925(IQ Score)2. Which of these is a 95% confidence interval for the slope of the population regression line?A. (.147, .838)B. (.143, .842)C. (-17.19, 18.17)D. (.237, .748)
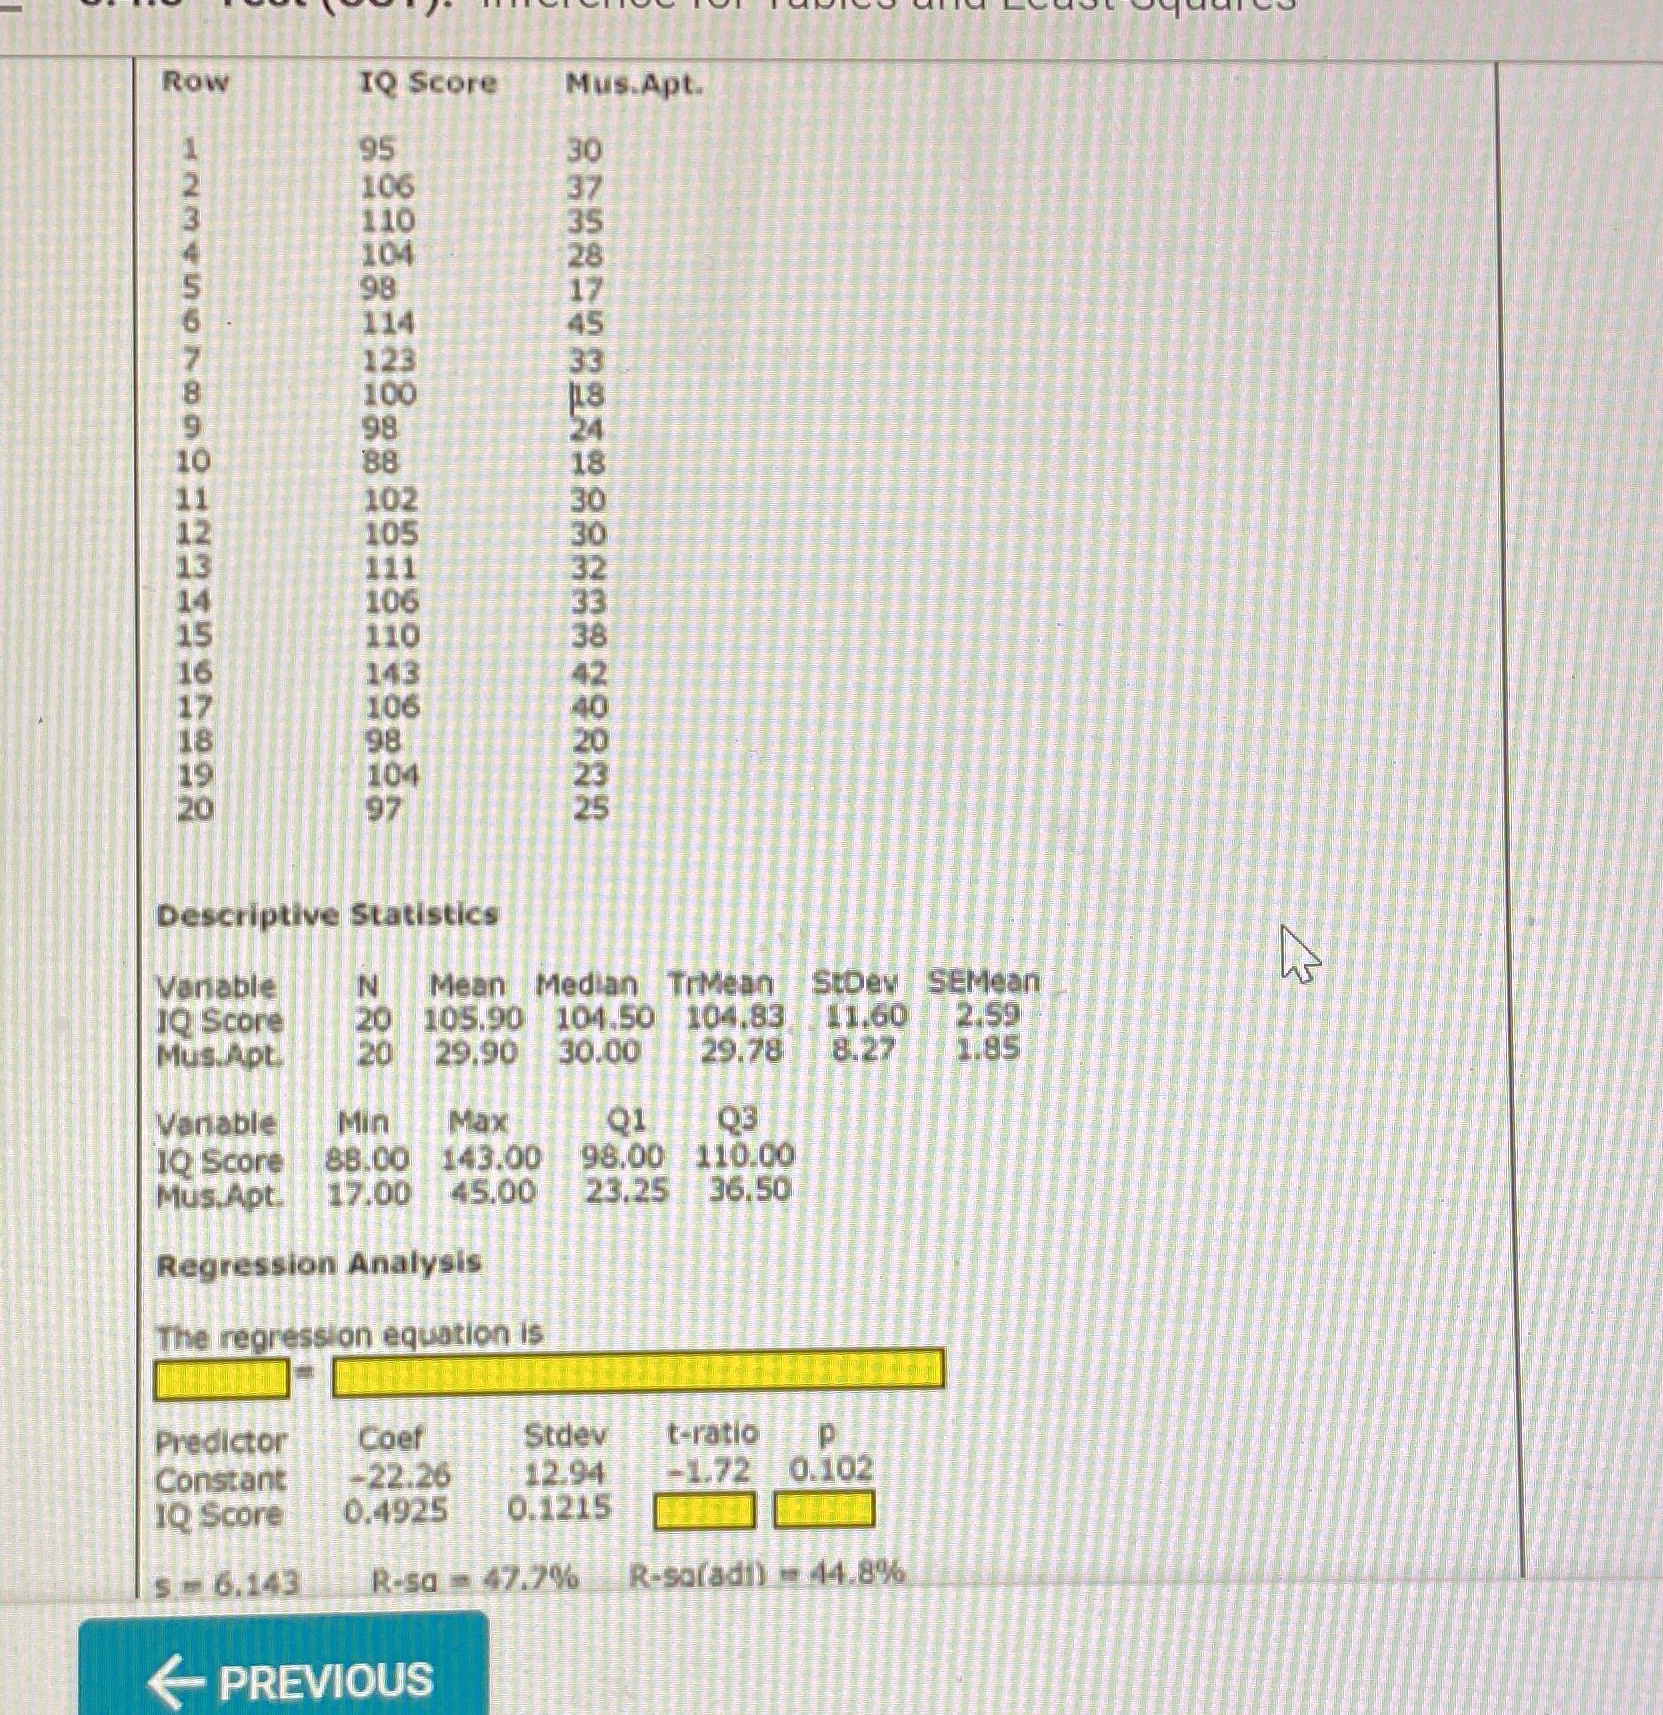
Row IQ Score Mus.Apt. 95 30 106 37 110 35 104 28 98 17 114 45 123 33 100 24 18 30 30 32 33 38 143 42 17 106 40 18 98 20 19 104 20 97 Descriptive Statistics Variable N Mean Median TrMean / StDev SEMean IQ Score 20 105.90 104.50 104,83 / 41.601 #2.59 Mus.Apt. 20 29.90 30.00 29.781 8.27 1.85 Variable Min Max Q1 03 1Q Score 85.00 143.00 98,00 110.00 Mus.Apt. 17.00 145.00 23.25 36.50 Regression Analysis The regression equation is Predictor Coef Stdev t-ratio Constant -22.26 12.94 -1.72 0.102 1Q Score 0.4925 0.1215 s- 6.143 R-sa - 47.7% R-saladi) 44.8% PREVIOUS
Step by Step Solution
There are 3 Steps involved in it

Get step-by-step solutions from verified subject matter experts