

Question: Part A) Refer to the Data Display printout to answer this question. Which of these is the equation of the regression line? 1Q Score =
Part A)
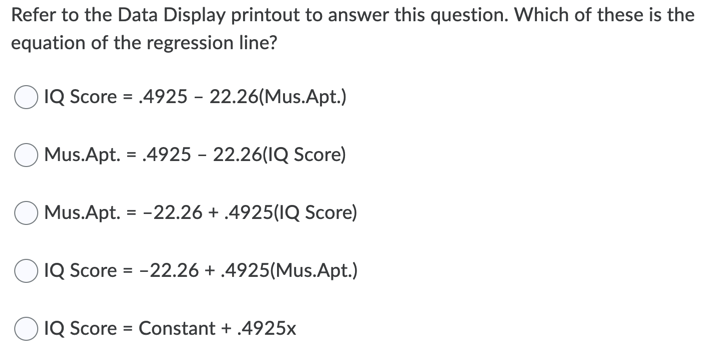
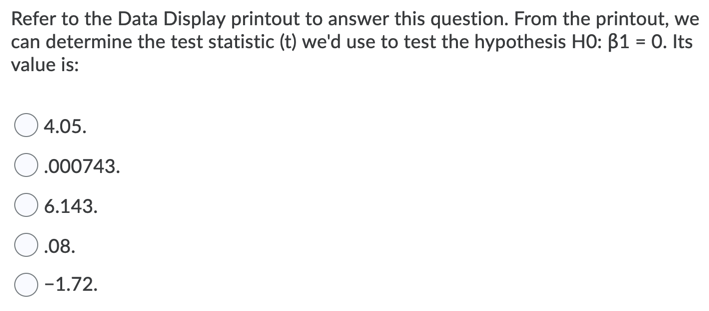
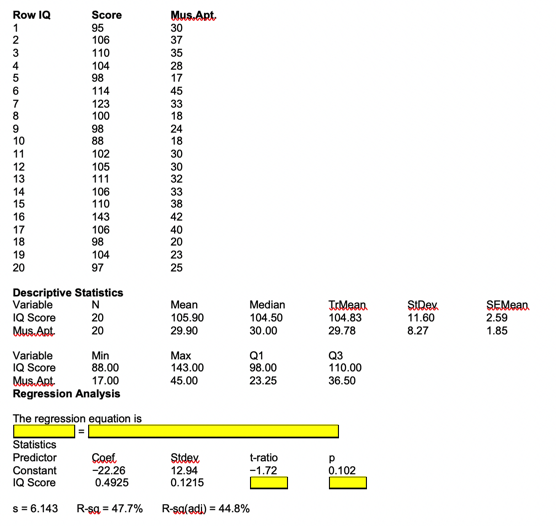
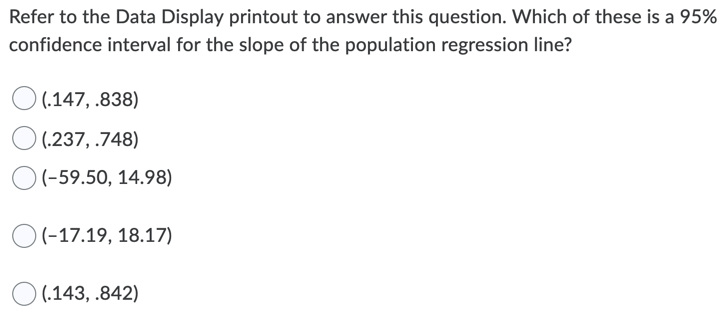
Refer to the Data Display printout to answer this question. Which of these is the equation of the regression line? 1Q Score = .4925 - 22.26(Mus.Apt.) Mus.Apt. = .4925 - 22.26(IQ Score) Mus.Apt. = -22.26 + .4925(1Q Score) O IQ Score = -22.26 + .4925(Mus.Apt.) 1Q Score = Constant + .4925xRefer to the Data Display printeut to answer this question. From the printout. we can determine the test statistic {t} we'd use to test the hypothesis HO: Bi = 0. Its value is: (Dates. ().oooa43. Row IQ Score Mus.Ant 95 30 106 37 110 35 104 28 98 17 114 45 123 33 100 18 98 24 10 88 18 11 102 30 12 105 30 13 111 32 14 106 33 15 110 38 16 143 42 17 106 40 18 98 20 19 104 23 20 97 25 Descriptive Statistics Variable N Mean Median ItMean SIDev SEMean IQ Score 20 105.90 104.50 104.83 11.60 2.59 Mus Apt 20 29.90 30.00 29.78 8.27 1.85 Variable Min Max Q1 Q3 IQ Score 88.00 143.00 98.00 110.00 Mus Apt 17.00 45.00 23.25 36.50 Regression Analysis The regression equation is Statistics Predictor Coel Stdev t-ratio Constant -22.26 -1.72 P 12.94 0.102 IQ Score 0.4925 0.1215 $ = 6.143 R-sa = 47.7% R-salad]) = 44.8%Refer to the Data Display printout to answer this question. Which of these is a 95% confidence interval for the slope of the population regression line? O (.147, .838) O(.237, .748) (-59.50, 14.98) O (-17.19, 18.17) O (.143, .842)
Step by Step Solution
There are 3 Steps involved in it

Get step-by-step solutions from verified subject matter experts