

Question: For questions 1 through 5 (Worth 1 point each), use the data (In $Millions} below from the latest Integrated Program Management Report (IPMR) from your
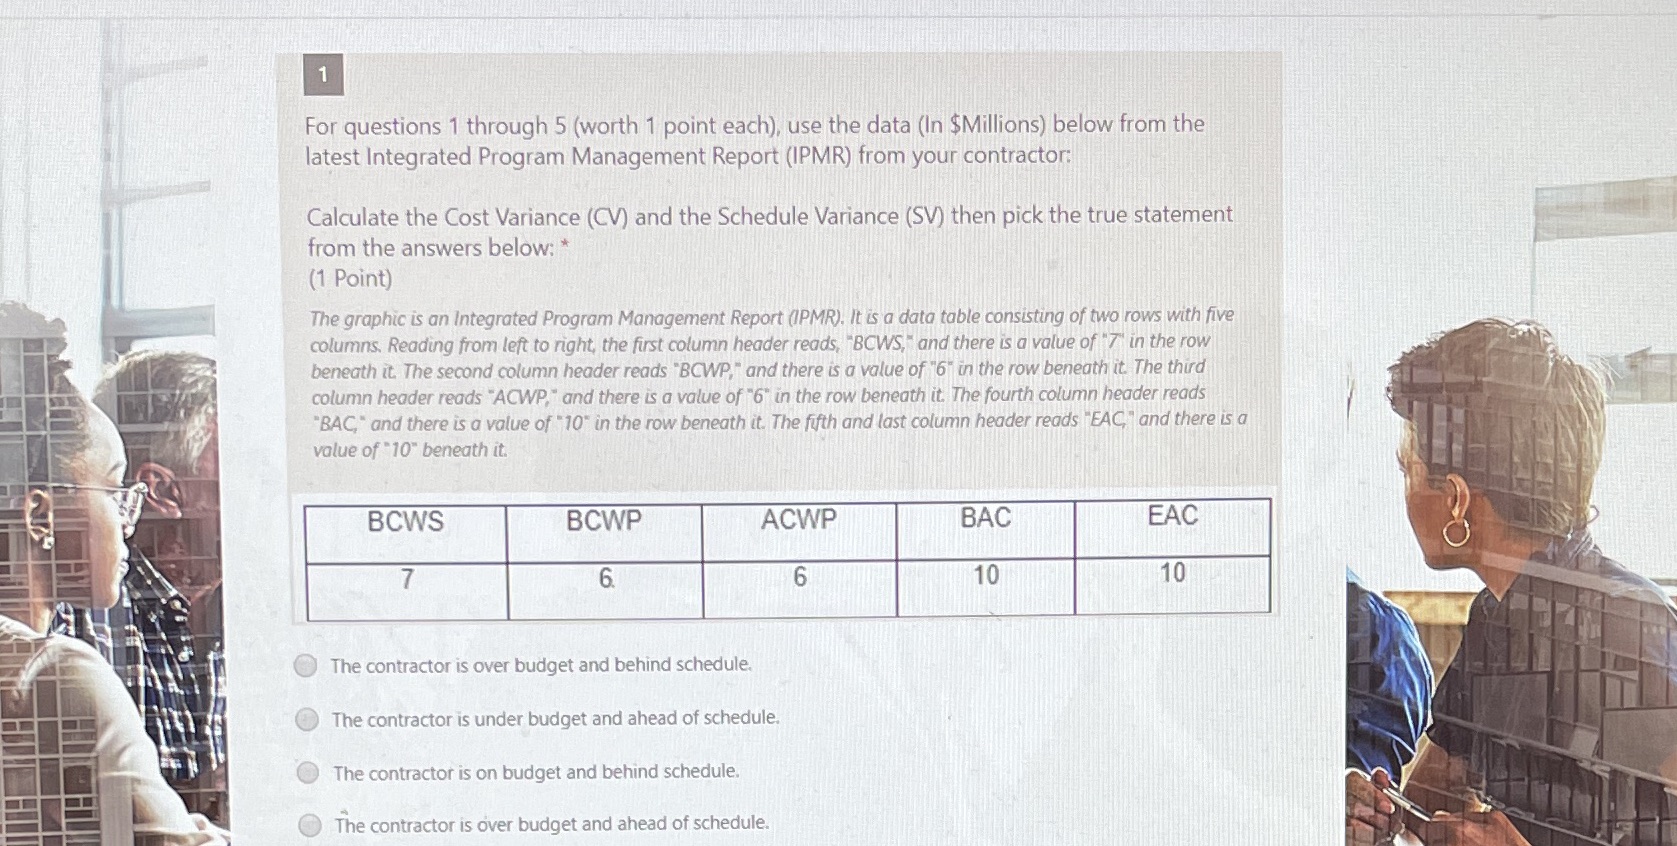
For questions 1 through 5 (Worth 1 point each), use the data (In $Millions} below from the latest Integrated Program Management Report (IPMR) from your contractor. Calculate the Cost Variance (CV) and the Schedule Variance (5V) then pick the true statement from the answers below: * (1 Point) Ihe graphic is an integrated Program Mamgement Report 0PMR). it is a data table consisting of two rows with ve columm Reading {mm left to right. the rst column header reads. "BCWS,' and there is a value of '7' in the raw beneath it. The second mlumn header reads 'BCWP,' and there is a value of '5\" in the row beneath it The third column header reads 'ACM',' and there is a value of '6' in the row beneath it. The fourth column header reads 'EMC' and there is a value of '10' in themwbeneath it. The fth undies! column header reads 'EAC,' and there in: value of ' 10' beneath it. ' O The contractor IS over budget and behind schedule. 0 The contractor IS under budget and ahead of schedule. 0 The contractor is on budget and behind schedule. O The contractor 15 liver budget and ahead of schedule
Step by Step Solution
There are 3 Steps involved in it

Get step-by-step solutions from verified subject matter experts