

Question: For questions 2.A and 2.B below, use the data sets to draw a graph using the dynamic macro model. Year Fed Funds Rate Inflation
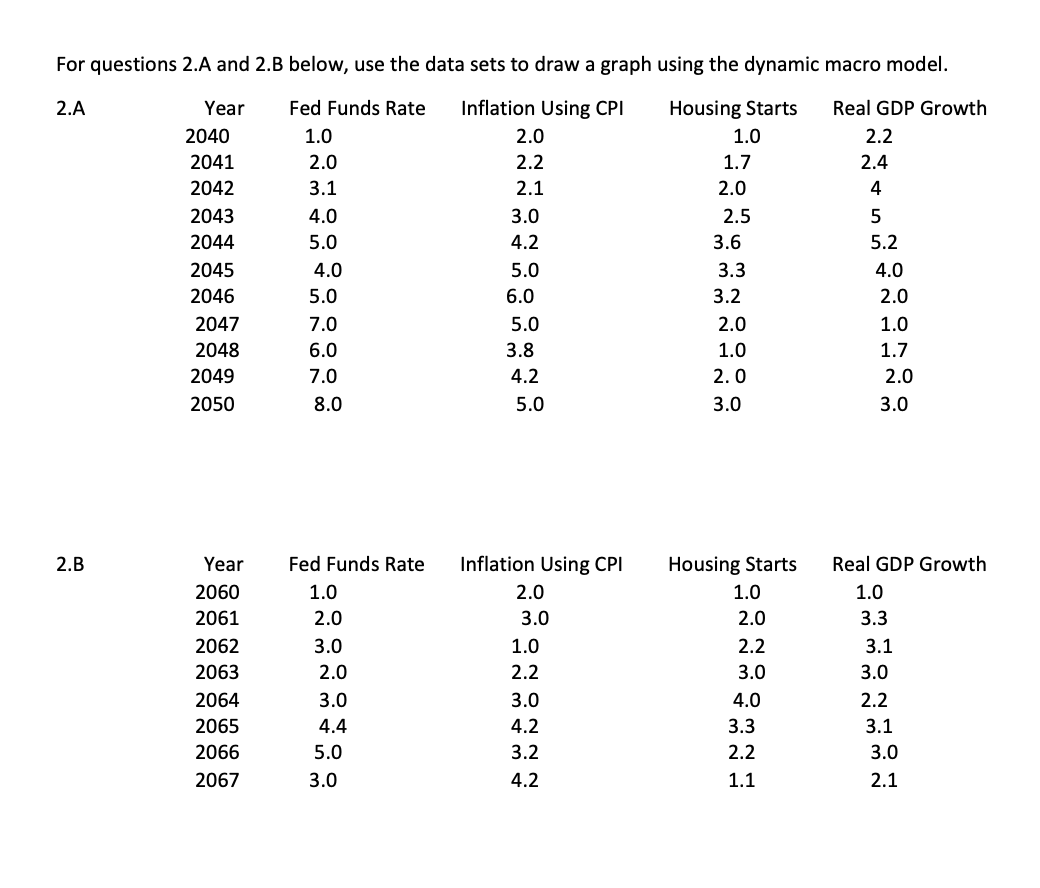
For questions 2.A and 2.B below, use the data sets to draw a graph using the dynamic macro model. Year Fed Funds Rate Inflation Using CPI 2.0 Housing Starts Real GDP Growth 1.0 1.0 2.2 2.0 2.2 3.1 2.1 2.A 2.B 2040 2041 2042 2043 2044 2045 2046 2047 2048 2049 2050 Year 2060 2061 2062 2063 2064 2065 2066 2067 4.0 5.0 4.0 5.0 7.0 6.0 7.0 8.0 Fed Funds Rate 1.0 2.0 3.0 2.0 3.0 4.4 5.0 3.0 3.0 4.2 5.0 6.0 5.0 3.8 4.2 5.0 Inflation Using CPI 2.0 3.0 1.0 2.2 3.0 4.2 3.2 4.2 1.7 2.0 2.5 3.6 3.3 3.2 2.0 1.0 2.0 3.0 Housing Starts 1.0 2.0 2.2 3.0 4.0 3.3 2.2 1.1 2.4 4 5 5.2 4.0 2.0 1.0 1.7 2.0 3.0 Real GDP Growth 1.0 3.3 3.1 3.0 2.2 3.1 3.0 2.1
Step by Step Solution
3.48 Rating (161 Votes )
There are 3 Steps involved in it
Here is the stepbystep and detailed workings to draw the graphs for the given data sets Step 1 Organ... View full answer

Get step-by-step solutions from verified subject matter experts