Question: For Questions 7 (20 points each) For the article below: Use the Answer sheet Write the number of the graph that best describes what happened.
For Questions 7 (20 points each)
For the article below: Use the Answer sheet
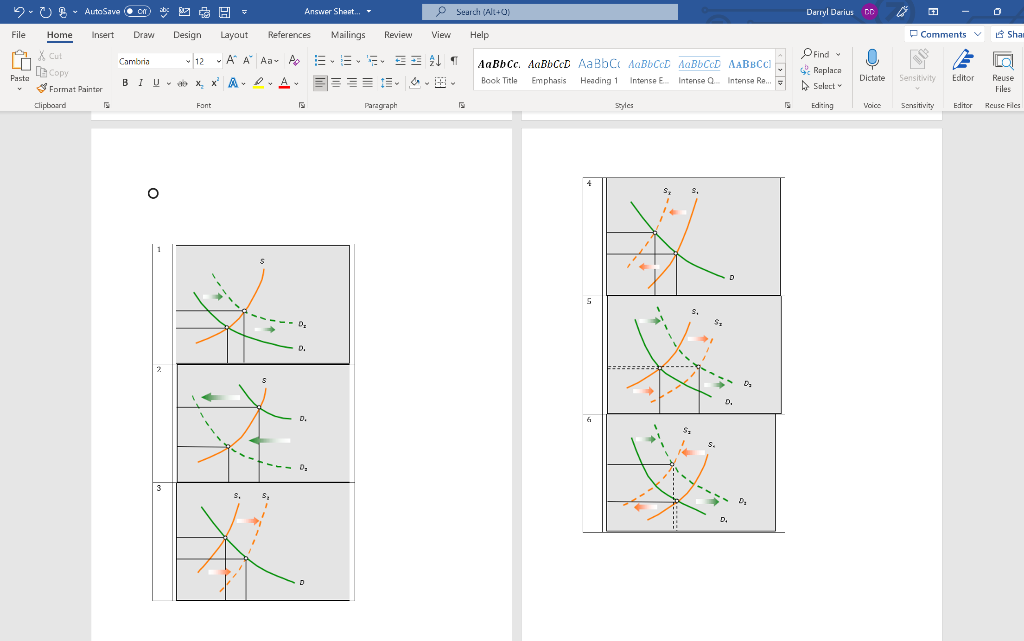
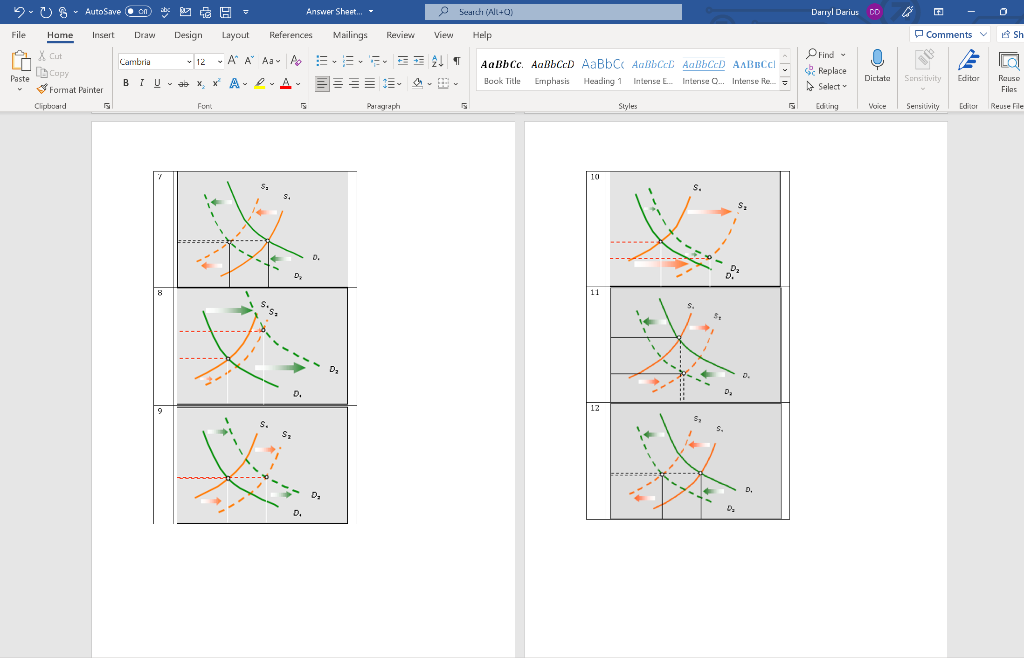
Write the number of the graph that best describes what happened.
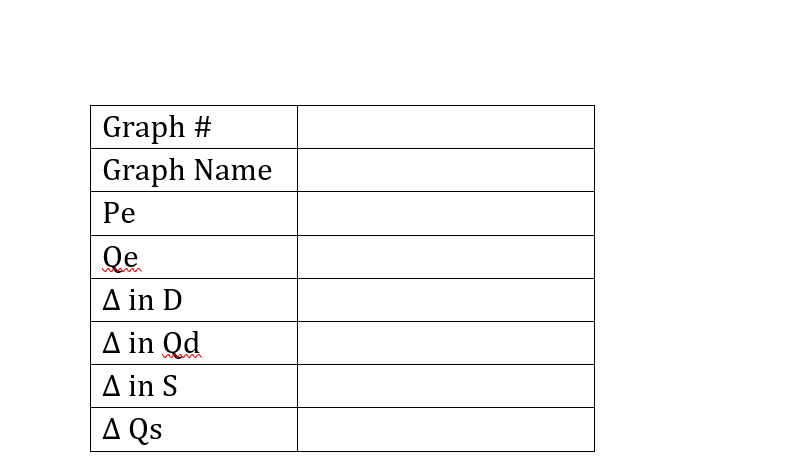
Fill in only the appropriate boxes in the chart for the article and be sure to indicate if it is an increase () or a decrease().
The economic impact of the Covid-19 Delta variant and rebounding output mean that expectations of global oil demand outstripping supply are fading OPEC, in its own report, significantly upgraded supply estimates The cartel raised its 2022 supply forecast by 840,000 barrels a day to 2.9 million. There is a decrease in demand for crude oil because of the Covid-19 variant.
OB AutoSave on CN Answer Shaat... - Search (Alt+O) ( Darryl Darius DC File Home Insert Draw Design Layout References Mailings Review View Help Comments Shar X Cut X [Copy $ Format Painter clipboard Camboria 12 A A A A Aar BIU do XX A. PA Et AaBb Cc. AaBbCD AaBb C AaBb CCD ABCD AABBCC) Book Title Emphasis Heading 1 Intense Intense E Intense Intense Re. O Find Replace Select Pasta Dictate Sensitivity Editor Reuse Files Font Paragraph F Styles Editing Voice Sensitivity Editor Reuse Files + D S S. Di S, D. D D 0. S $ 0 s. $ D. D 90S 2-US-AutoSave on os - Answer Sheet... - Search (Alt+O) Darryl Darius DO File Home Insert Draw Design Layout References Mailings Review View Help Comments Sh X Cut X Cambria 12 A A A A , += 21 Copy AaBbc. Aabbcc AaBbc Aabbcc AabbCcD AABECCI Book Title Emphasis Heading 1 Intense Intense O.. Intense le. - Find Replace Select Paste Dictate Sensitivity Editar BIV * X * A--A- Rause Filas Format Painter Clipboard Font Paragraph Styles Editing Voice Sensitivity Editor Reuse File 10 S S. 0. Da D. D 11 5.50 Ses D. 12 S s S. SE D. D D. Graph # Graph Name Pe Qe in D A in Qd A in S Qs


