

Question: for second one : please include calibration curve thanks Data Collection Table 1. Absorbance Values at 447 nm for Calibration Curve and concentration of [Fe(SCN)
![of [Fe(SCN) 2+1. Sample calculation for [Fe(SCN) 2 ]) Table 2: Absorbance](https://dsd5zvtm8ll6.cloudfront.net/si.experts.images/questions/2024/09/66f900b13325d_67266f900b0d3856.jpg)
for second one :
![Values at 447nm for Equilibrium Constant and concentration of [Fe(SCN)2+] calculated from](https://dsd5zvtm8ll6.cloudfront.net/si.experts.images/questions/2024/09/66f900b1ba408_67366f900b15f1f9.jpg)
please include calibration curve
thanks
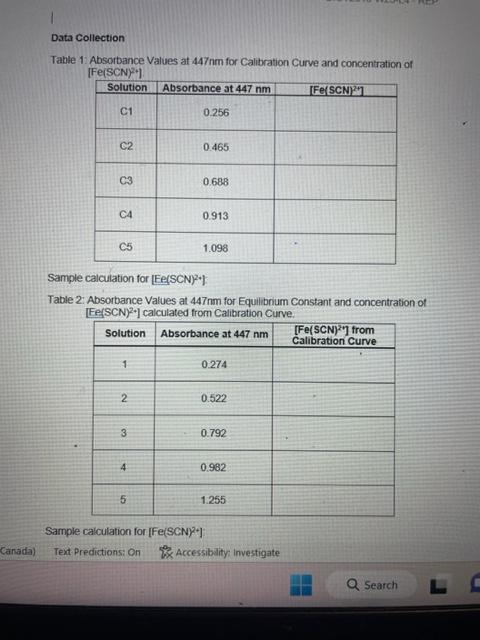
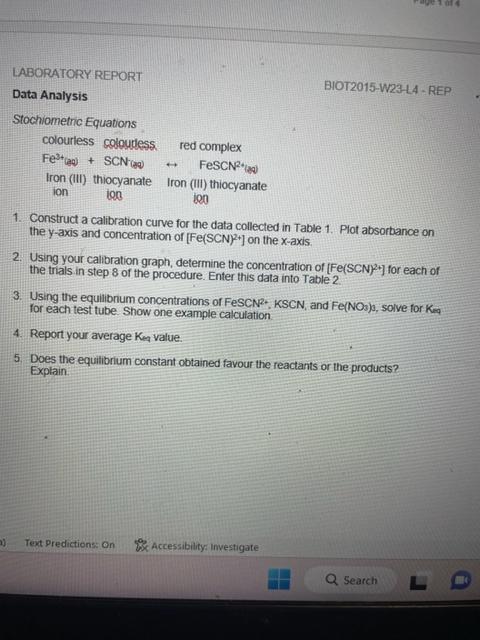
Data Collection Table 1. Absorbance Values at 447 nm for Calibration Curve and concentration of [Fe(SCN) 2+1. Sample calculation for [Fe(SCN) 2 ]) Table 2: Absorbance Values at 447nm for Equilibrium Constant and concentration of [Fe(SCN)2+] calculated from Calibration Curve. Sample calculation for [Fe(SCN) 2+] : LABORATORY REPORT Data Analysis BIOT2015-W23-L4 - REP Stochiometric Equations colourlesscoloudessredcomplexFe3t(la)+SCN(x0)FeSCN2(max) Iron (III) thiocyanate Iron (III) thiocyanate ion ion ion 1. Construct a calibration curve for the data collected in Table 1. Plot absorbance on the y-axis and concentration of [Fe(SCN)2+] on the x-axis. 2. Using your calibration graph, determine the concentration of [Fe(SCN)2+] for each of the trials in step 8 of the procedure. Enter this data into Table 2. 3. Using the equilibnum concentrations of FeSCN2;KSCN, and Fe(NO3), solve for Kmma for each test tube. Show one example calculation. 4. Report your average Ken value. 5. Does the equilbrium constant obtained favour the reactants or the products? Explain. 3. Prepare solutions as described in the following table: 4. Cover each test tube with parafilm and invert three times to ensure solutions are thoroughly mixed. 5. Transfer 1mL of each standard solution to five cuvettes. Prepare a blank using the 0.5MHNO3. 9. Cover each test tube with parafilm and invert three times to ensure solutions are thoroughly mixed. Allow 10 minutes for solutions to reach equilibrium. 10. Set the wavelength at 447nm. Measure the absorbance values for each solution using the spectrophotometer. Analysis See Lab Report Data Collection Table 1. Absorbance Values at 447 nm for Calibration Curve and concentration of [Fe(SCN) 2+1. Sample calculation for [Fe(SCN) 2 ]) Table 2: Absorbance Values at 447nm for Equilibrium Constant and concentration of [Fe(SCN)2+] calculated from Calibration Curve. Sample calculation for [Fe(SCN) 2+] : LABORATORY REPORT Data Analysis BIOT2015-W23-L4 - REP Stochiometric Equations colourlesscoloudessredcomplexFe3t(la)+SCN(x0)FeSCN2(max) Iron (III) thiocyanate Iron (III) thiocyanate ion ion ion 1. Construct a calibration curve for the data collected in Table 1. Plot absorbance on the y-axis and concentration of [Fe(SCN)2+] on the x-axis. 2. Using your calibration graph, determine the concentration of [Fe(SCN)2+] for each of the trials in step 8 of the procedure. Enter this data into Table 2. 3. Using the equilibnum concentrations of FeSCN2;KSCN, and Fe(NO3), solve for Kmma for each test tube. Show one example calculation. 4. Report your average Ken value. 5. Does the equilbrium constant obtained favour the reactants or the products? Explain. 3. Prepare solutions as described in the following table: 4. Cover each test tube with parafilm and invert three times to ensure solutions are thoroughly mixed. 5. Transfer 1mL of each standard solution to five cuvettes. Prepare a blank using the 0.5MHNO3. 9. Cover each test tube with parafilm and invert three times to ensure solutions are thoroughly mixed. Allow 10 minutes for solutions to reach equilibrium. 10. Set the wavelength at 447nm. Measure the absorbance values for each solution using the spectrophotometer. Analysis See Lab Report
Step by Step Solution
There are 3 Steps involved in it

Get step-by-step solutions from verified subject matter experts