

Question: For SPSS, What numbers should be inputted to have test occur. Show all the steps to get a graph Scenario: Researchers were interested in testing
For SPSS, What numbers should be inputted to have test occur. Show all the steps to get a graph
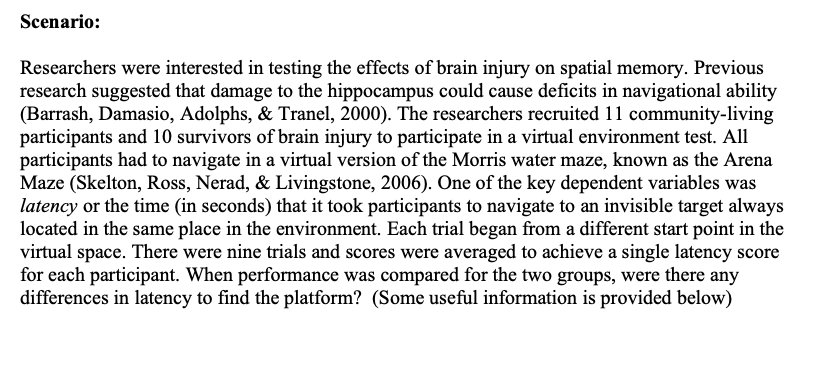
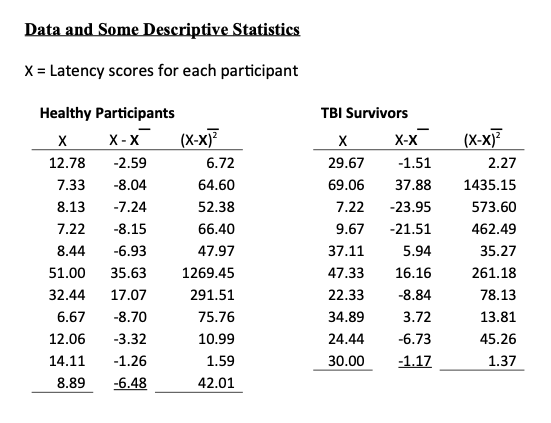
Scenario: Researchers were interested in testing the effects of brain injury on spatial memory. Previous research suggested that damage to the hippocampus could cause deficits in navigational ability (Barrash, Damasio, Adolphs, & Tranel, 2000). The researchers recruited 11 community-living participants and 10 survivors of brain injury to participate in a virtual environment test. All participants had to navigate in a virtual version of the Morris water maze, known as the Arena Maze (Skelton, Ross, Nerad, & Livingstone, 2006). One of the key dependent variables was latency or the time in seconds) that it took participants to navigate to an invisible target always located in the same place in the environment. Each trial began from a different start point in the virtual space. There were nine trials and scores were averaged to achieve a single latency score for each participant. When performance was compared for the two groups, were there any differences in latency to find the platform? (Some useful information is provided below) Data and Some Descriptive Statistics X = Latency scores for each participant Healthy Participants X X-X (X-x)2 12.78 -2.59 6 .72 7.33 -8.04 64.60 8.13 -7.24 52.38 7.22 -8.15 66.40 8.44 -6.93 47.97 51.00 35.63 1269.45 32.44 17.07 291.51 6.67 8.70 75.76 12.06 -3.32 1 0.99 14.11 -1.26 1.59 8.89 -6.48 42.01 TBI Survivors X-X 29.67 -1.51 69.06 37.88 7.22 -23.95 9.67 -21.51 5.94 47.33 16.16 22.33 -8.84 34.89 3.72 24.44 -6.73 30.00 -1.17 (X-x)? 2.27 1435.15 573.60 462.49 35.27 261.18 78.13 13.81 45.26 37.11 1.37 Scenario: Researchers were interested in testing the effects of brain injury on spatial memory. Previous research suggested that damage to the hippocampus could cause deficits in navigational ability (Barrash, Damasio, Adolphs, & Tranel, 2000). The researchers recruited 11 community-living participants and 10 survivors of brain injury to participate in a virtual environment test. All participants had to navigate in a virtual version of the Morris water maze, known as the Arena Maze (Skelton, Ross, Nerad, & Livingstone, 2006). One of the key dependent variables was latency or the time in seconds) that it took participants to navigate to an invisible target always located in the same place in the environment. Each trial began from a different start point in the virtual space. There were nine trials and scores were averaged to achieve a single latency score for each participant. When performance was compared for the two groups, were there any differences in latency to find the platform? (Some useful information is provided below) Data and Some Descriptive Statistics X = Latency scores for each participant Healthy Participants X X-X (X-x)2 12.78 -2.59 6 .72 7.33 -8.04 64.60 8.13 -7.24 52.38 7.22 -8.15 66.40 8.44 -6.93 47.97 51.00 35.63 1269.45 32.44 17.07 291.51 6.67 8.70 75.76 12.06 -3.32 1 0.99 14.11 -1.26 1.59 8.89 -6.48 42.01 TBI Survivors X-X 29.67 -1.51 69.06 37.88 7.22 -23.95 9.67 -21.51 5.94 47.33 16.16 22.33 -8.84 34.89 3.72 24.44 -6.73 30.00 -1.17 (X-x)? 2.27 1435.15 573.60 462.49 35.27 261.18 78.13 13.81 45.26 37.11 1.37
Step by Step Solution
There are 3 Steps involved in it

Get step-by-step solutions from verified subject matter experts