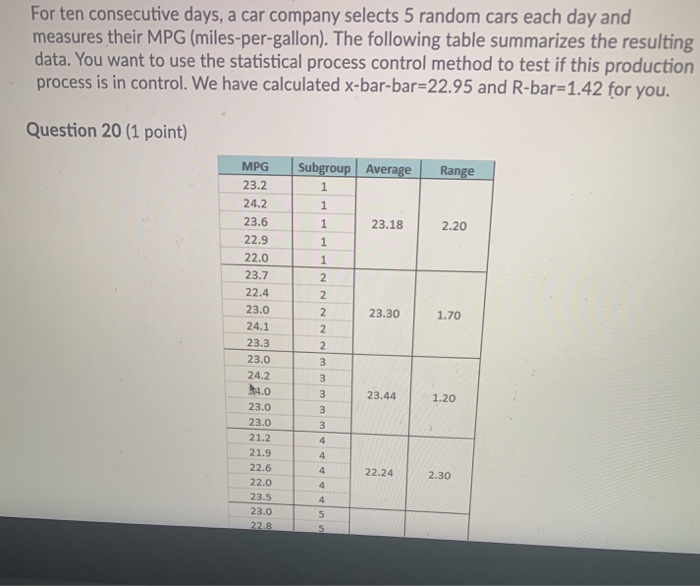
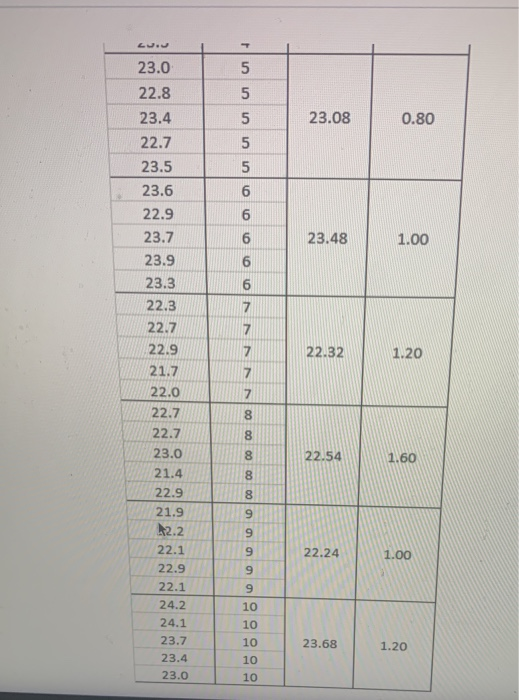
Question: For ten consecutive days, a car company selects 5 random cars each day and measures their MPG (miles-per-gallon). The following table summarizes the resulting data.

For ten consecutive days, a car company selects 5
For ten consecutive days, a car company selects 5 random cars each day and measures their MPG (miles-per-gallon). The following table summarizes the resulting data. You want to use the statistical process control method to test if this production process is in control. We have calculated x-bar-bar=22.95 and R-bar=1.42 for you. Question 20 (1 point) Subgroup Average Range 1 1 1 23.18 2.20 23.30 1.70 MPG 23.2 24.2 23.6 22.9 22.0 23.7 22.4 23.0 24.1 23.3 23.0 24.2 4.0 23.0 23.0 21.2 21.9 22.6 22.0 23.5 23.0 22.8 1 1 2 2 2 2 2 3 3 3 3 3 4 4 23.44 1.20 22.24 2.30 4 5 5 Cou 5 5 23.01 22.8. 5 23.08 0.80 5 5 5 5 6 6 6 6 6 23.48 1.00 7 7 17 22.32 1.20 23.4 22.7 23.5 23.6) 22.9 23.7 23.9 23.3 22.3 22.7 122.9 21.7 22.0 22.7 22.7 23.0 21.4 22.9 21.9 A2.2 22.1 22.9 22.1 24.2 24.1 23.7 23.4 23.0 7 7 8 8 8 122.54 1,600 8 8 819 9 9 9 900 22.24 1.00 10 10 10 10 23.68 1.20 10 23.68 1.20 23.7 23.4 23.0 10 10 10 Calculate the Upper Control Limit for the x-bar chart. Please provide your numerical answers with three digits after the decimal (ex: 1.003, etc...) Your Answer: Answer Question 21 (1 point) Calculate the Lower Control Limit for the x-bar chart. Please provide your numerical answers with three digits after the decimal (ex: 1.003, etc...) Your Answer: Answer Question 22 (1 point) Calculate the Upper Control Limit for the R chart. Please provide your numerical answers with three digits after the decimal (ex: 1.003, etc...) Your Answer: Answer Question 23 (1 point) Calculate the Lower Control Limit for the R chart. Your Answer: Answer Question 24 (3 points) Plot the x-bar chart and R-chart (No need to submit your charts). Based on those charts, what is your conclusion for this process? There is only one correct answer. The process is out of control, because there is at least one point outside the control limits in the x-bar or/and R chart. The process is out of control, because there are at least 7 points in a row on one side of the central line in the x-bar or/and R chart. The process is out of control, because there are at least 7 points in a row going up or going down in the x-bar or/and R chart. None of Above

Step by Step Solution

There are 3 Steps involved in it

1 Expert Approved Answer
Step: 1 Unlock blur-text-image
Question Has Been Solved by an Expert!

Get step-by-step solutions from verified subject matter experts

Step: 2 Unlock
Step: 3 Unlock

Students Have Also Explored These Related General Management Questions!