

Question: For testing the difference between the two population means using paired data, we set the test of hypotheses Ho : - 2 = 0,
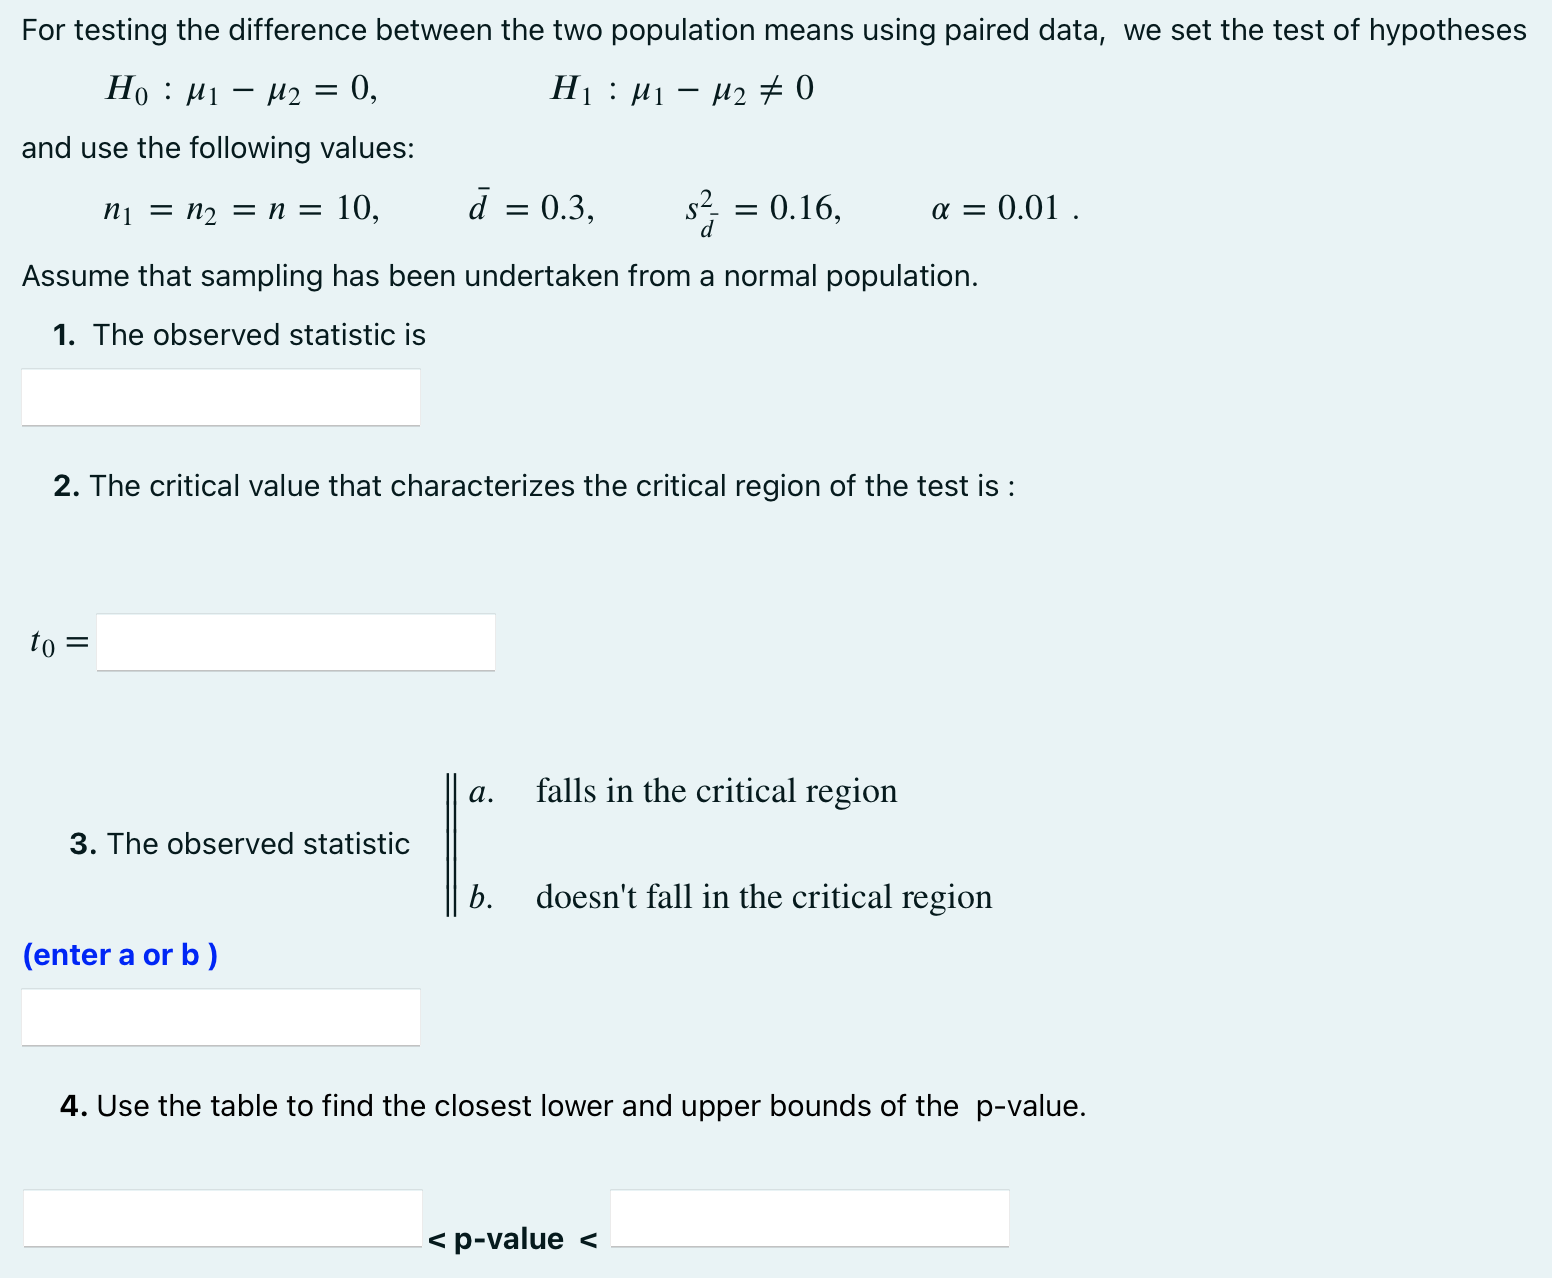
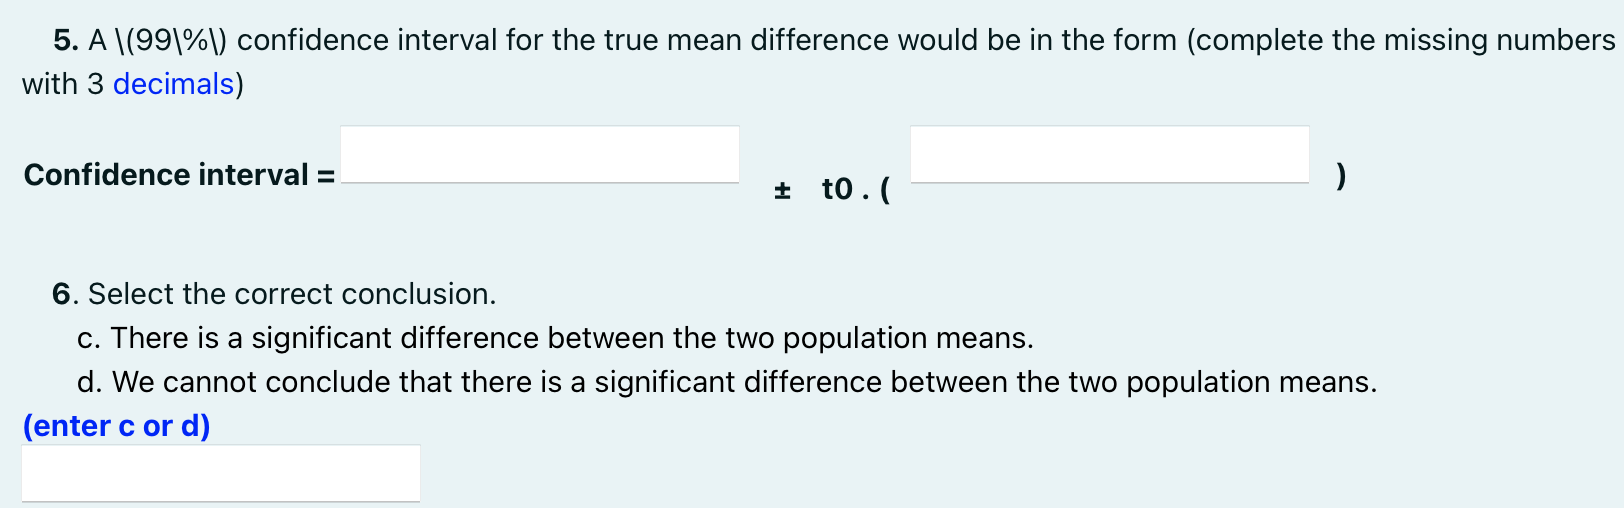
For testing the difference between the two population means using paired data, we set the test of hypotheses Ho : - 2 = 0, and use the following values: : - 2 # 0 n = n = n = 10, a = 0.3, $ == 0.16, = 0.01 . d Assume that sampling has been undertaken from a normal population. 1. The observed statistic is 2. The critical value that characterizes the critical region of the test is : to = 3. The observed statistic (enter a or b) a. falls in the critical region b. doesn't fall in the critical region 4. Use the table to find the closest lower and upper bounds of the p-value. < p-value 5. A \(99%) confidence interval for the true mean difference would be in the form (complete the missing numbers with 3 decimals) Confidence interval = to. ( 6. Select the correct conclusion. c. There is a significant difference between the two population means. d. We cannot conclude that there is a significant difference between the two population means. (enter c or d)
Step by Step Solution
There are 3 Steps involved in it

Get step-by-step solutions from verified subject matter experts