

Question: For the 2014 sample data, what is the value of the sample statistics,pooled proportion,standard error for the hypothesis test, test statistics and p- value D
For the 2014 sample data, what is the value of the sample statistics,pooled proportion,standard error for the hypothesis test, test statistics and p- value
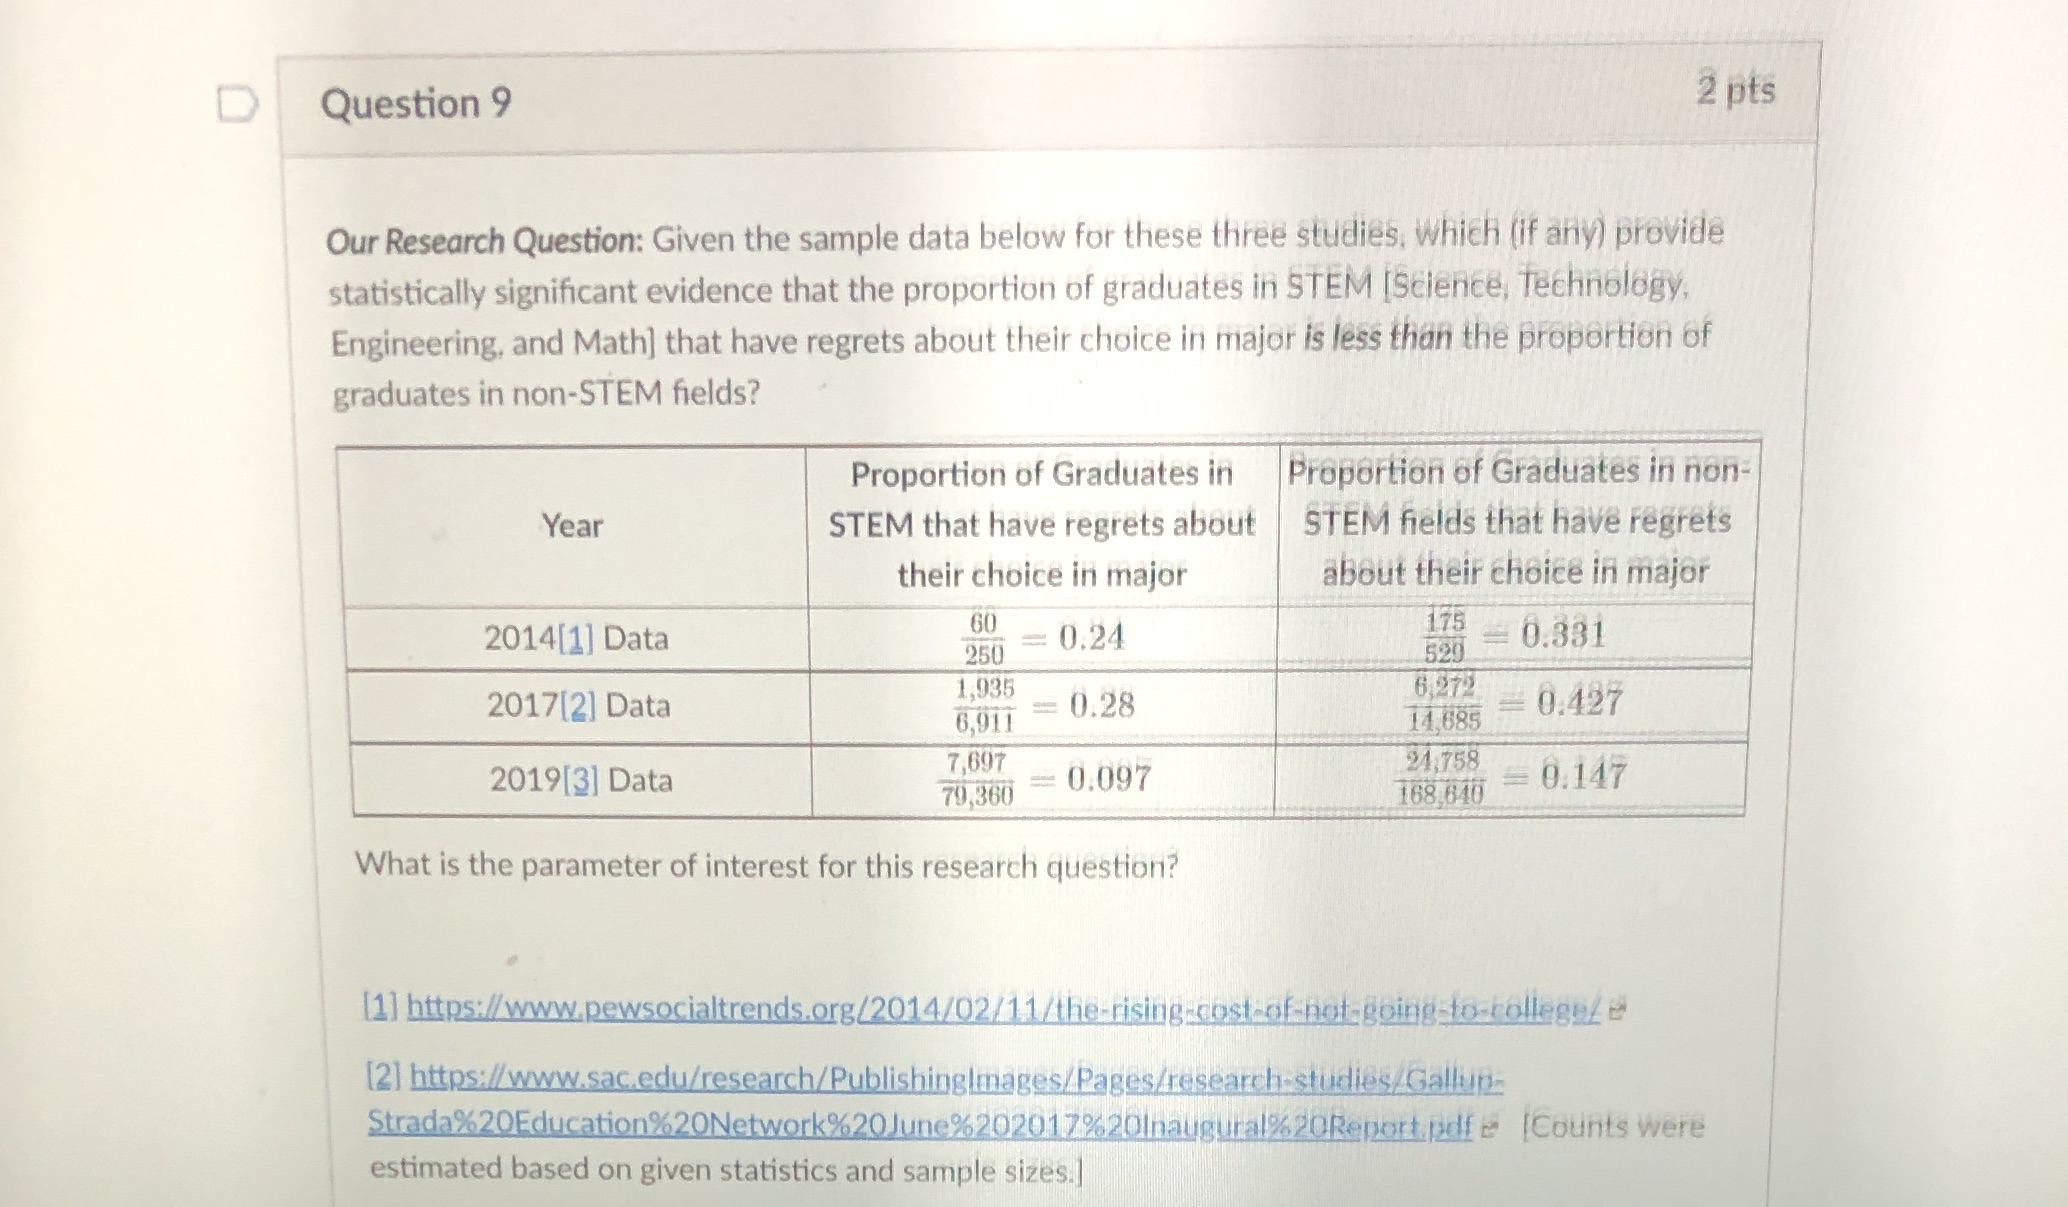
D Question 9 2 pts Our Research Question: Given the sample data below for these three studies, Which (if any) provide statistically significant evidence that the proportion of graduates in STEM [Science, Technology, Engineering, and Math] that have regrets about their choice in major is less than the proportion of graduates in non-STEM fields? Proportion of Graduates in Proportion of Graduates in non- Year STEM that have regrets about STEM fields that have regrets their choice in major about their choice in major 2014[1] Data 60 = 0.24 175 250 520 0.331 2017[2] Data 1,935 6,911 = 0.28 6,272 14,685 = 0:427 2019[3] Data 7,697 24,758 79,360 = 0.097 168.640 = 0:147 What is the parameter of interest for this research question? [1] https://www.pewsocialtrends.org/2014/02/11/the-rising-cost of-not-going to-college/ ex [2] https:/www.sac.edu/research/PublishingImages/Pages/research-studies/Gallup. Strada%20Education%20Network%20June%202017%20inaugural%20Report.pdf [Counts were estimated based on given statistics and sample sizes.]
Step by Step Solution
There are 3 Steps involved in it

Get step-by-step solutions from verified subject matter experts