

Question: For the 2014 sample data what is the value of the sample statistic, the pooled proportion, the standard error of the hypothesis, the test statistic
For the 2014 sample data what is the value of the sample statistic, the pooled proportion, the standard error of the hypothesis, the test statistic , and the P value?

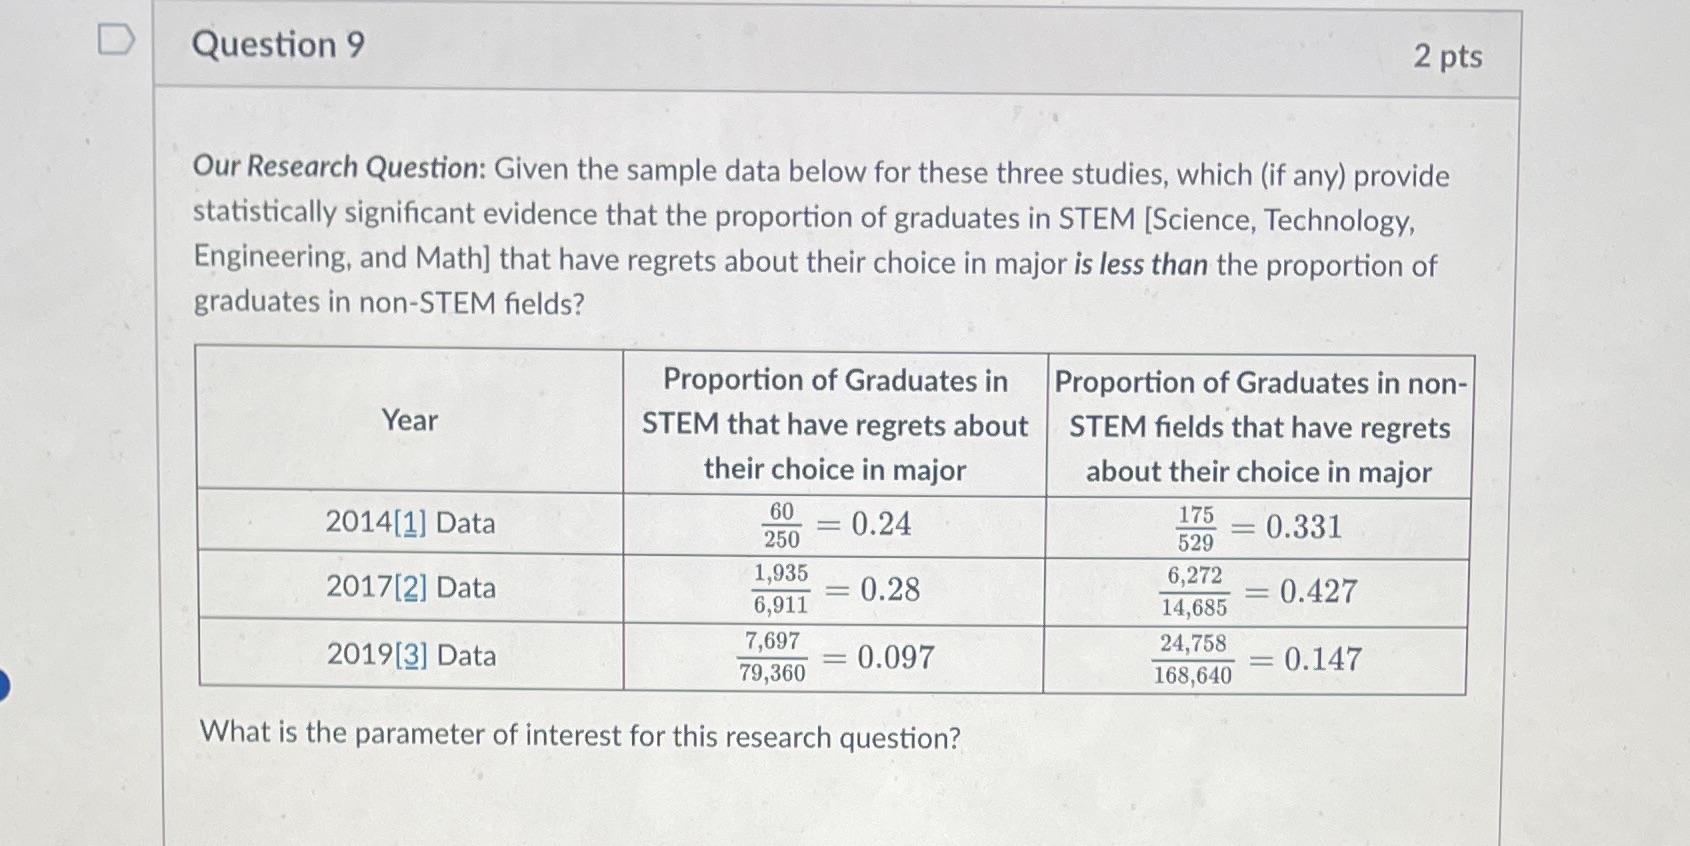
D Question 9 2 pts Our Research Question: Given the sample data below for these three studies, which (if any) provide statistically significant evidence that the proportion of graduates in STEM [Science, Technology, Engineering, and Math] that have regrets about their choice in major is less than the proportion of graduates in non-STEM fields? Proportion of Graduates in Proportion of Graduates in non- Year STEM that have regrets about STEM fields that have regrets their choice in major about their choice in major 2014[1] Data 60 = 0.24 175 = 0.331 250 529 1,935 2017[2] Data 0.28 6,272 0.427 6,911 14,685 7,697 79,360 0.097 24,758 2019[3] Data 168,640 0.147 What is the parameter of interest for this research
Step by Step Solution
There are 3 Steps involved in it

Get step-by-step solutions from verified subject matter experts