

Question: For the 3 - bus network shown in Figure 1 , the associated measurement and standard deviation ( ) of each meter are given in
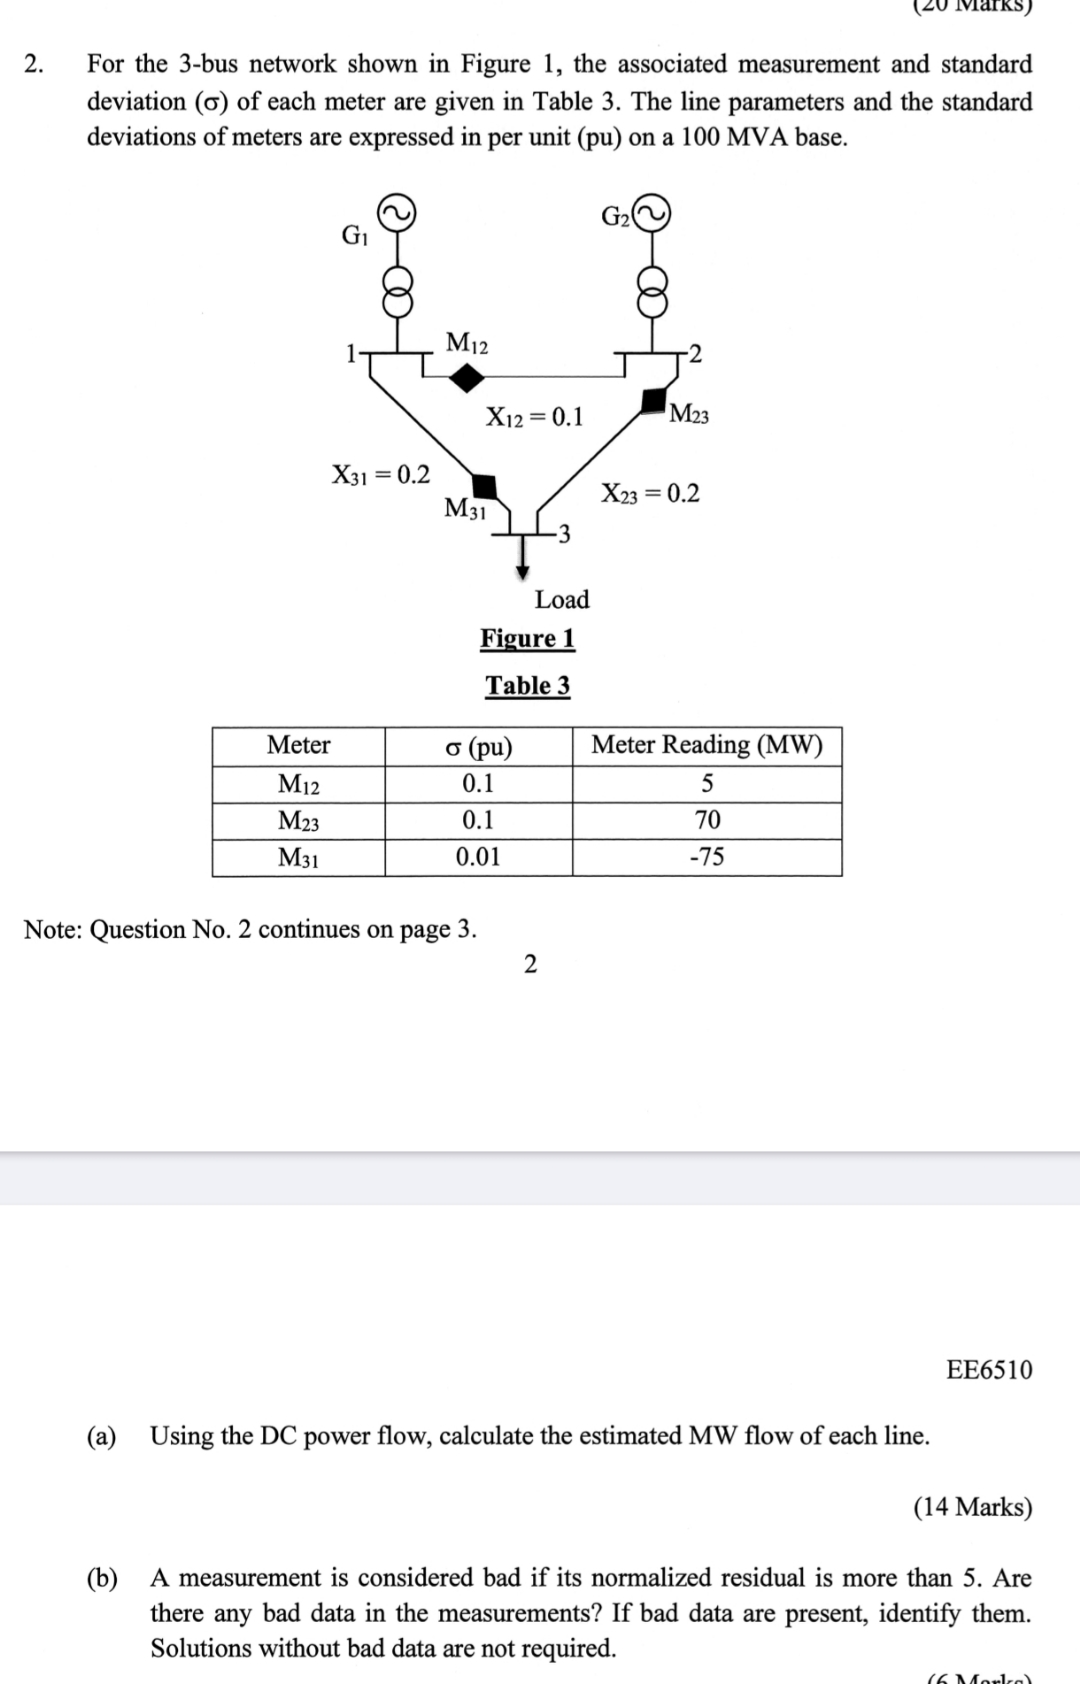
For the bus network shown in Figure the associated measurement and standard deviation of each meter are given in Table The line parameters and the standard deviations of meters are expressed in per unit pu on a MVA base.
Table
tableMeterMeter Reading MW
Note: Question No continues on page
EE
a Using the DC power flow, calculate the estimated MW flow of each line.
Marks
b A measurement is considered bad if its normalized residual is more than Are there any bad data in the measurements? If bad data are present, identify them. Solutions without bad data are not required.
Step by Step Solution
There are 3 Steps involved in it
1 Expert Approved Answer
Step: 1 Unlock

Question Has Been Solved by an Expert!
Get step-by-step solutions from verified subject matter experts
Step: 2 Unlock
Step: 3 Unlock