

Question: For the case analysis Walt Disney: 1) Give a summary of the case so those who have not read it know a little about the
For the case analysis Walt Disney:
1) Give a summary of the case so those who have not read it know a little about the case. (One to two paragraphs)
2) Provide a short analysis focused beyond what the case summary has provided, pick to areas to expand on. What factors do you see are working, what could be improved, what are the challenges you see for the future.
Mission and Vision (Does the mission and vision of the company guide there future? What stands out?)
Internal Factors (What are the internal issues they need to address?)
External Factors (What external factors should they be aware of or looking to address: i.e. political, economy, competition, etc (SWAT)
Diversification (Are they too diversified?
Management, operations or Human Resources (what issues do you see in their management? etc...
Remember to keep it simple, short and to the point. Dive into the essence of the company and breakout what you see could be better or needs to improve.
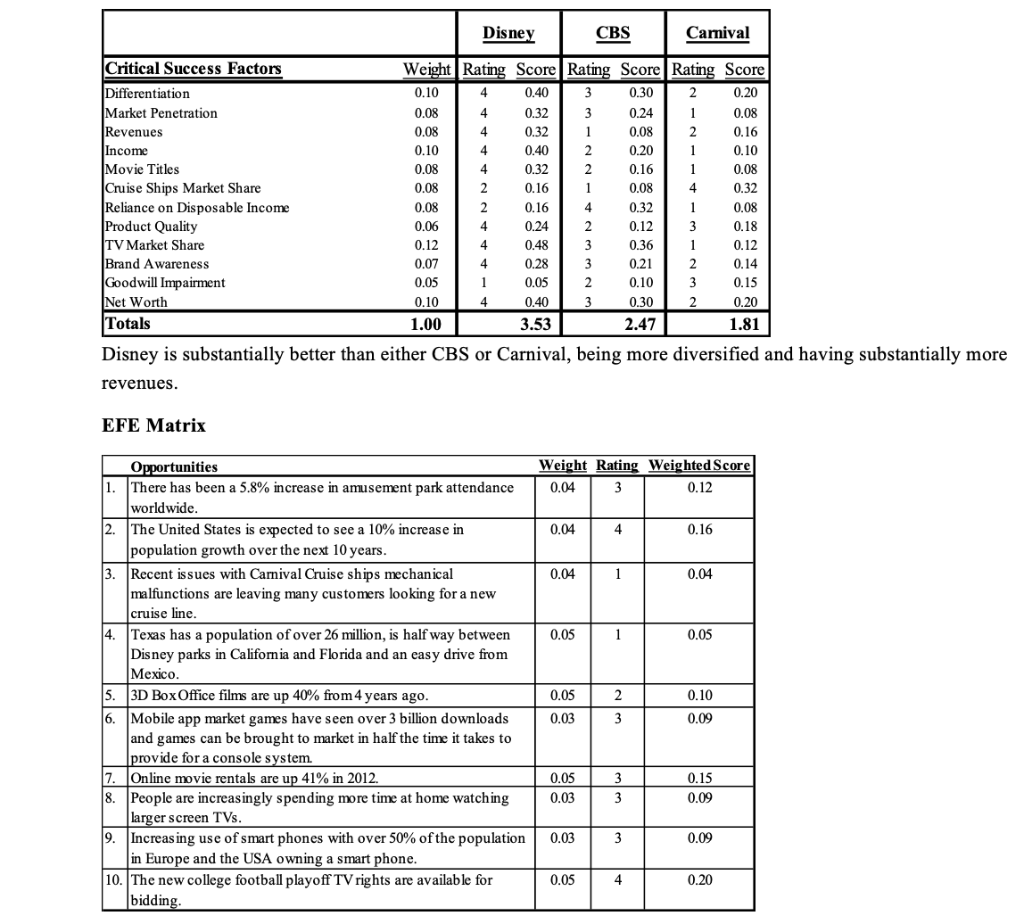
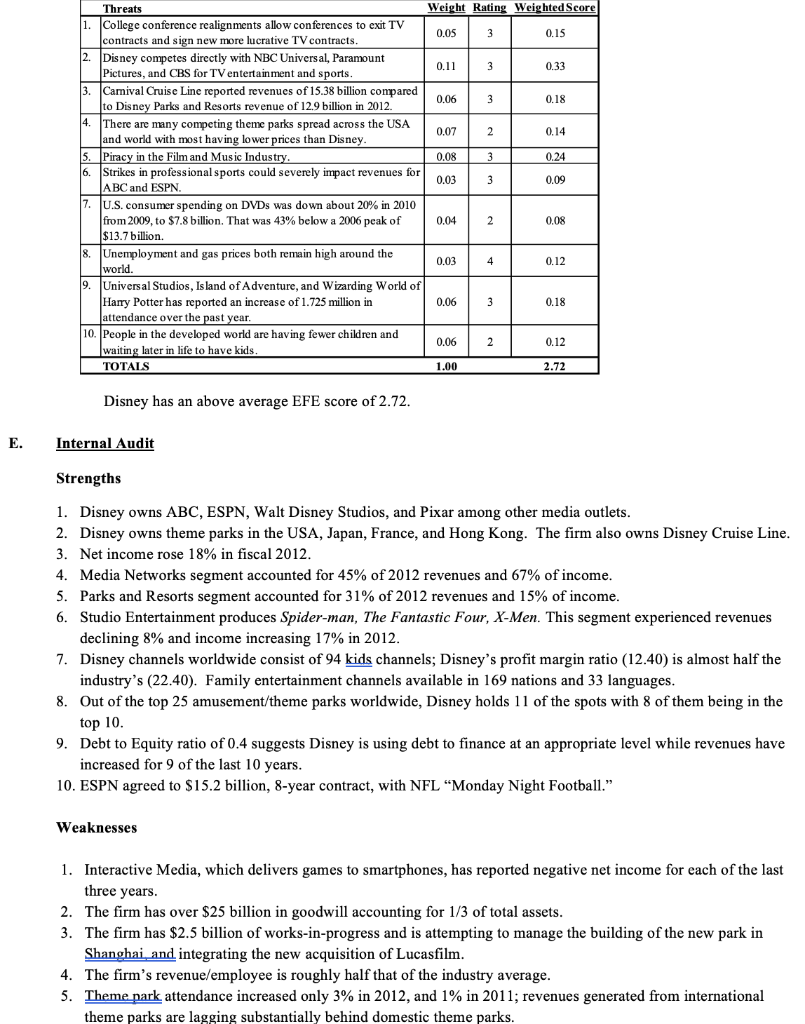
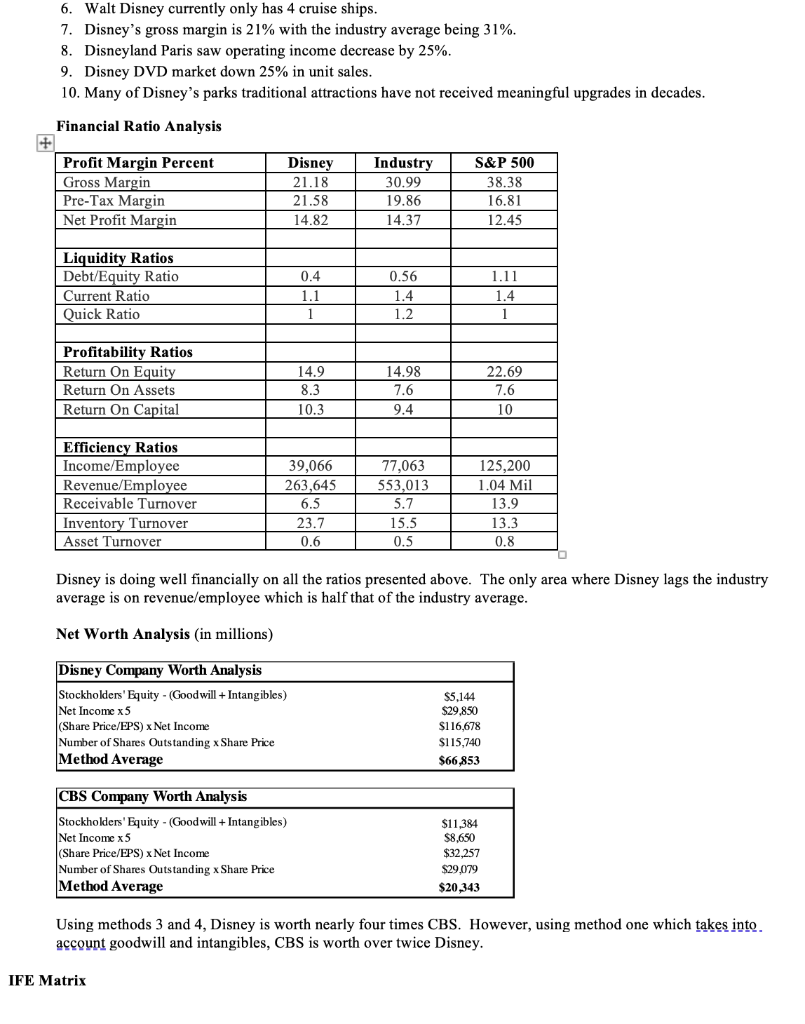
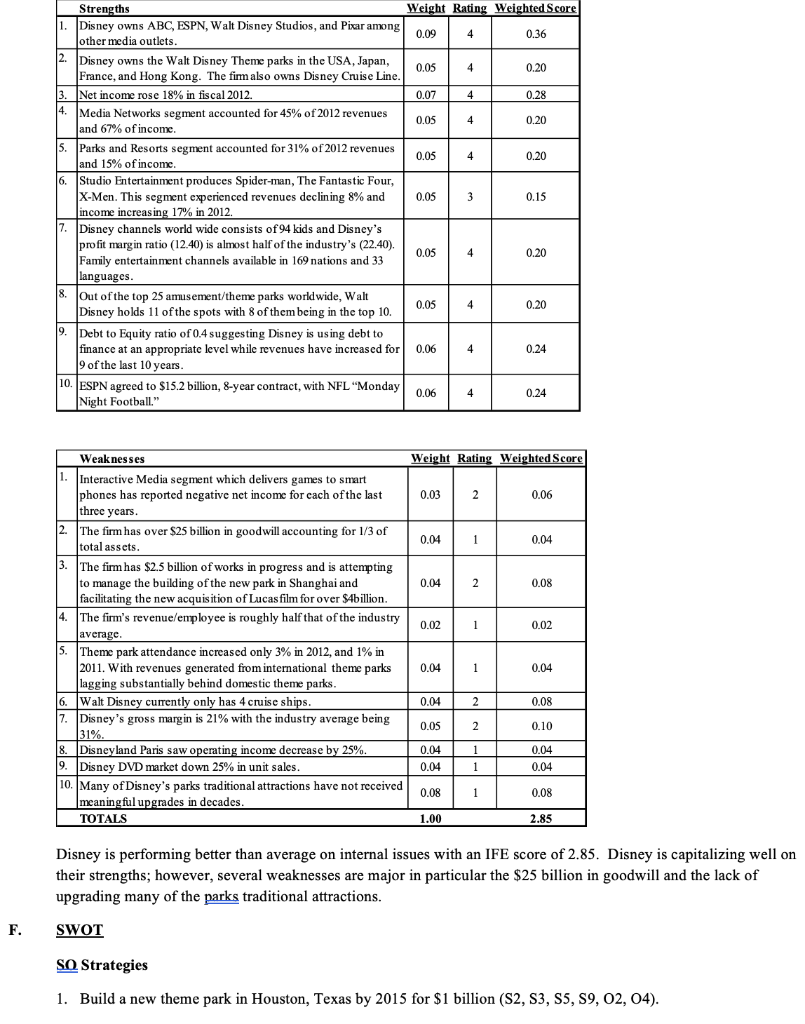
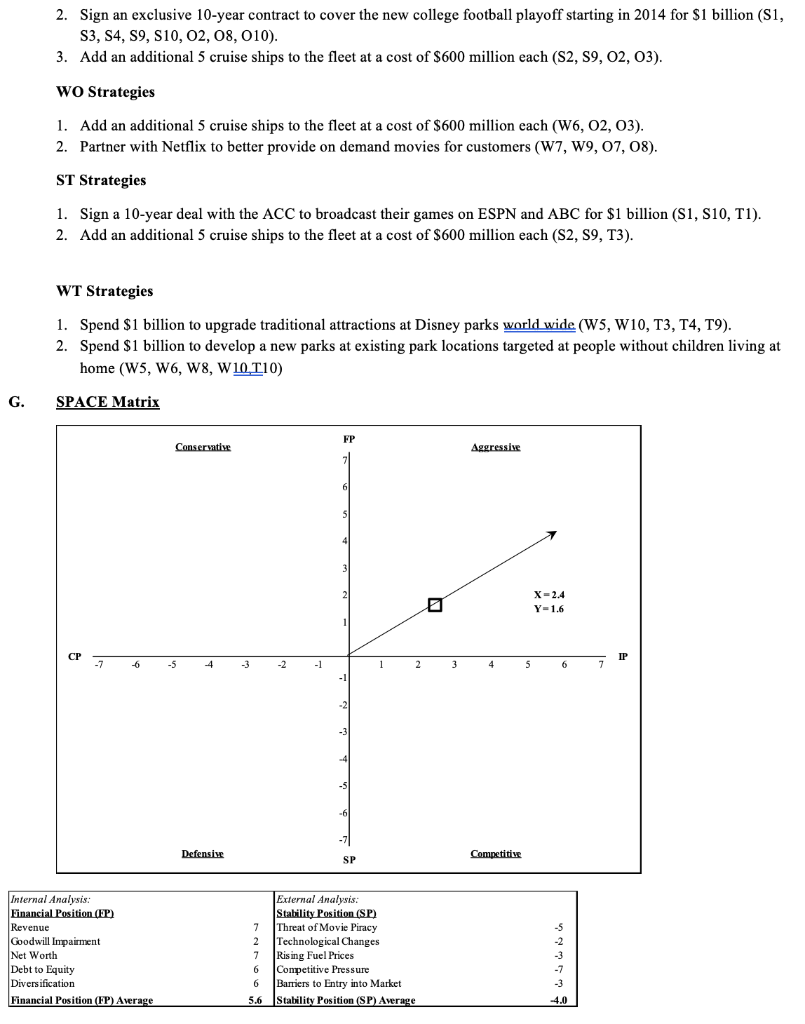
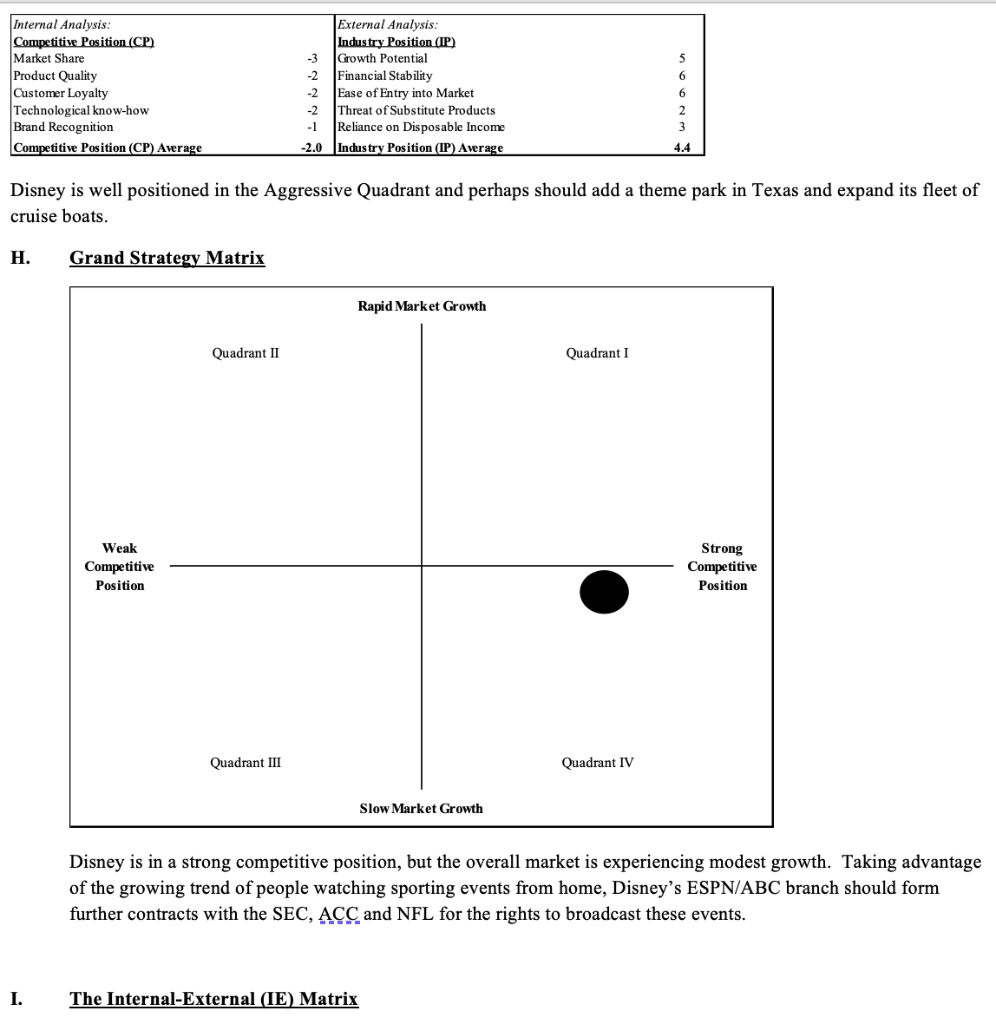
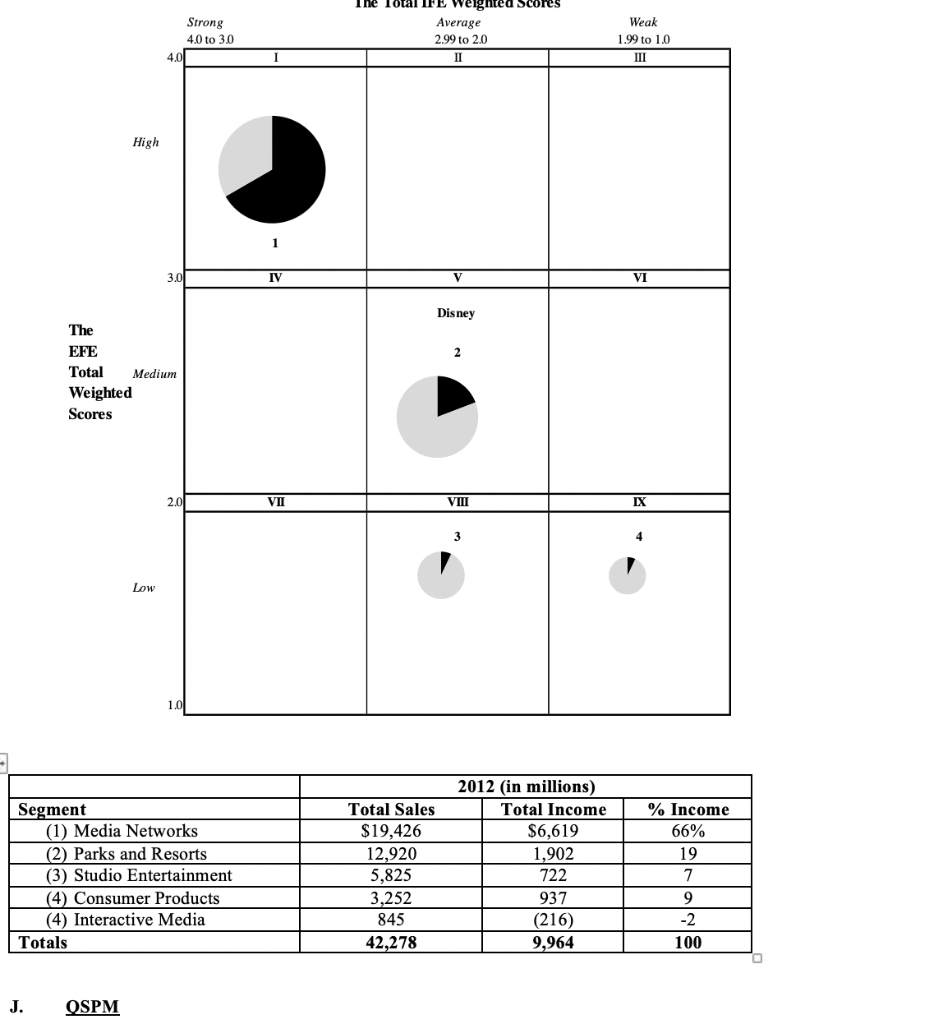
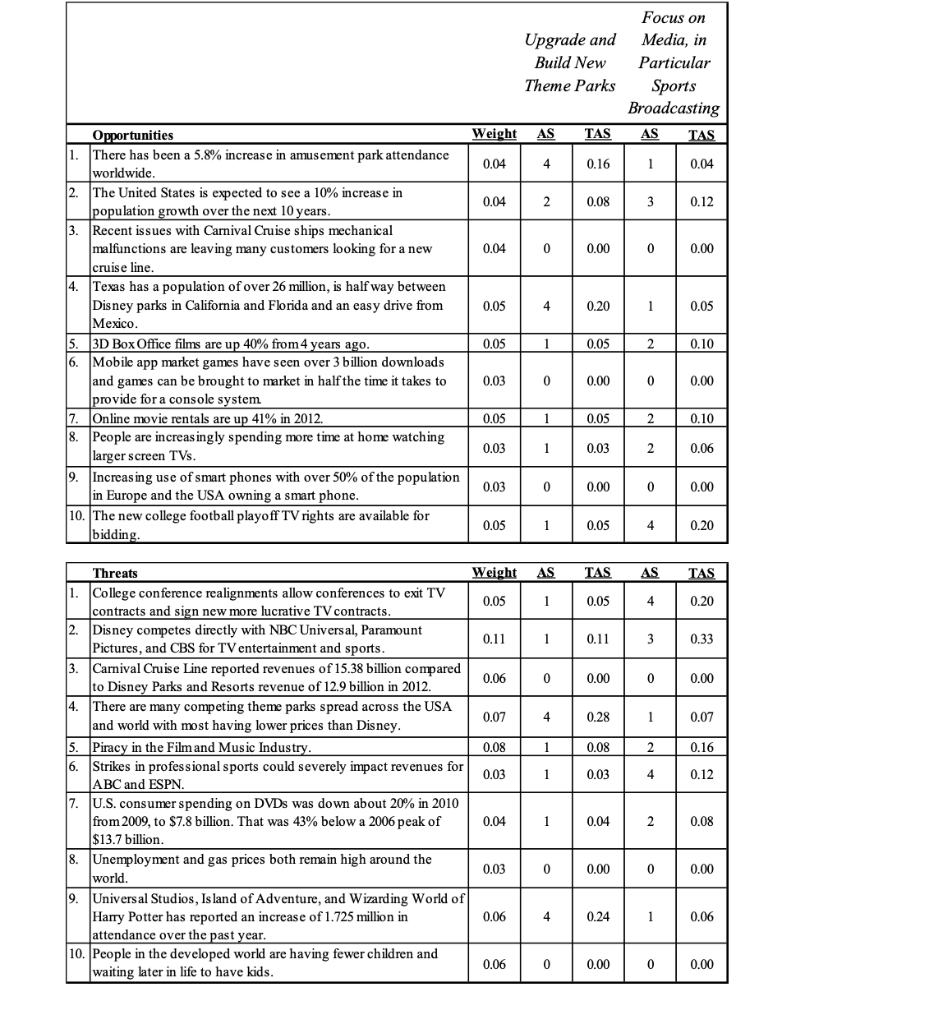
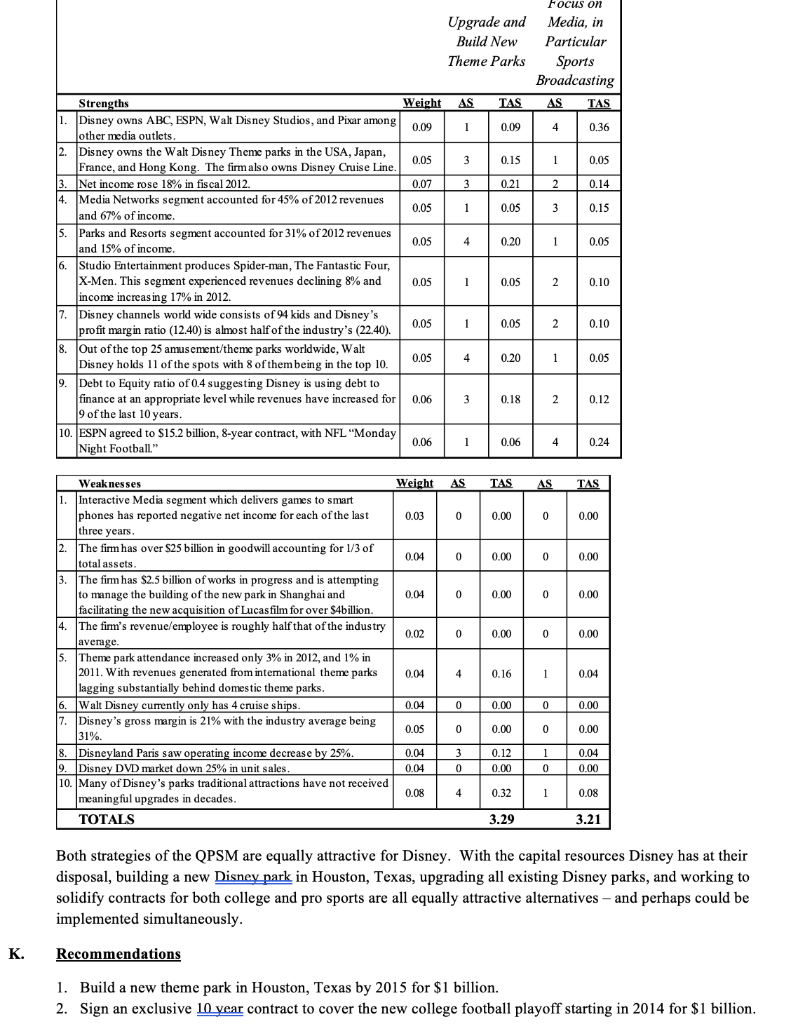
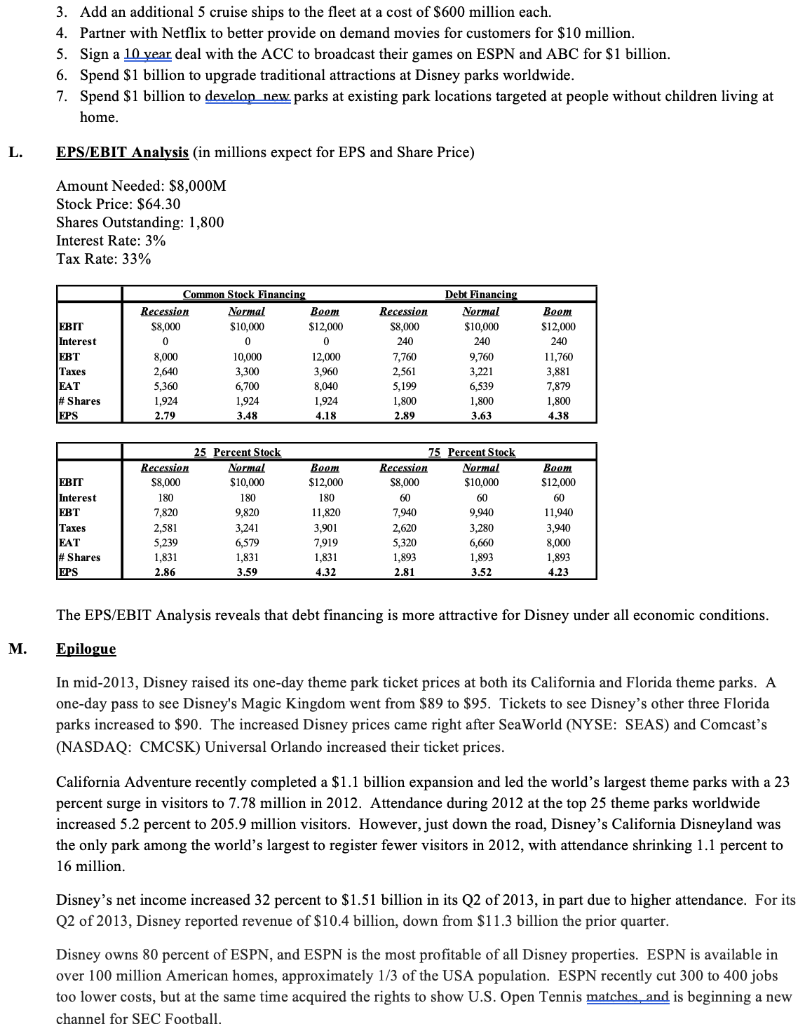
The Walt Disney Company - 2013 Forest R. David A. Case Abstract The Walt Disney Company is an entertainment company with worldwide operations. Disney's two largest segments are Media Networks and Parks and Recreation. Media Networks consists of ABC, ESPN, Disney films, newly acquired Lucusfilms, 35 radio stations, among others. Parks and Recreation includes the world. famous Disney theme parks and the more recent Disney cruise line. Disney has theme parks in the USA, France, China, and Hong Kong. In addition, Disney operates three other divisions: Studio Entertainment, Consumer Products, and Interactive Media. The Interactive Media segment (aimed around smartphone game apps) has been struggling, recently reporting a net loss for calendar 2012. Headquartered in Burbank, California, Disney reported revenues of over $42 billion in 2012, up 3 percent from the previous year. B. Vision Statement (actual) To make people happy (proposed) To offer the best family entertainment in the world through theme parks, cruises, movies, and radio and television coverage of news and sporting events globally. c. Mission Statement (actual) To be one of the world's (3) leading producers and providers of entertainment and information (2). Using our portfolio of brands to differentiate our content, services and consumer products we seek to develop the most creative, innovative and profitable entertainment experiences and related products in the world (5). (proposed) We are on a mission everyday to serve customers young and old (1) with outstanding family entertainment. By offering popular theme parks and Disney TV programming to our newly acquired ABC, ESPN, and cruise lines (2), we provide well-diversified family entertainment (5) worldwide (3). We utilize many Disney characters such as Mickey Mouse and Donald Duck (7) to excite customers globally. We produce apps for smartphones throughout Interactive Media division (4). We give back generously to our communities (6) and offer many internships for deserving college students (8). Everything we do at Disney could is possible because of our great employees (9) and fans worldwide. 1. Customers 2. Products or services 3. Markets 4. Technology 5. Concern for survival, growth, and profitability 6. Philosophy 7. Self-concept 8. Concern for public image 9. Concern for employees D. External Audit Opportunities 1. There has been a 5.8% increase in amusement park attendance worldwide. 2. The USA is expected to see a 10% increase in population growth over the next 10 years. 3. Recent issues with Carnival Cruise ships mechanical malfunctions are leaving many customers looking for a new cruise line. 4. Texas has a population of over 26 million, is half way between Disney parks in California and Florida and an easy drive from Mexico. 5. 3D Box Office films are up 40% from 4 years ago 6. Mobile app market games have seen over 3 billion downloads and games can be brought to market in half the time it takes to provide for a console system. 7. Online movie rentals are up 41% in 2012. 8. People are increasingly spending more time at home watching larger screen TVs. 9. Increasing use of smartphones with over 50% of the population in Europe and the USA owning a smartphone. 10. The new college football playoff TV rights are available for bidding. Threats 1. College conference realignments allow conferences to exit TV contracts and sign new more lucrative TV contracts. 2. Disney competes directly with NBC Universal, Paramount Pictures, and CBS for TV entertainment and sports. 3. Carnival Cruise Line reported revenues of $15.38 billion compared to Disney Parks and Resorts revenue of $12.9 billion in 2012. 4. There are many competing theme parks across the USA and world with most having lower prices than Disney. 5. Piracy in the Film and Music Industry. 6. Strikes in professional sports could severely impact revenues for ABC and ESPN. 7. U.S. consumer spending on DVDs was down about 20% in 2010 from 2009, to $7.8 billion. That was 43% below a 2006 peak of $13.7 billion 8. Unemployment and gas prices both remain high around the world. 9. Universal Studios, Island of Adventure, and Wizarding World of Harry Potter has reported an increase of 1.725 million in attendance over the past year. 10. People in the developed world are having fewer children and waiting later in life to have kids. Competitive Profile Matrix Disney CBS Camival 0.24 Critical Success Factors Differentiation Market Penetration Revenues Income Movie Titles Cruise Ships Market Share Reliance on Disposable Income Product Quality TV Market Share Brand Awareness Goodwill Impairment Net Worth Totals Weight Rating Score Rating Score Rating Score 0.10 4 0.40 3 0.30 2 0.20 0.08 4 0.32 3 0.08 0.08 4 0.32 1 0.08 2 0.16 0.10 4 0.40 2 0.20 1 0.10 0.08 0.32 2 0.16 1 0.08 0.08 2 0.16 1 0.08 4 0.32 0.08 2 0.16 4 0.32 1 0.08 0.06 4 0.24 2 0.12 3 0.18 0.12 4 0.48 3 0.36 1 0.12 0.07 4 0.28 3 0.21 0.14 0.05 1 0.05 2 0.10 3 0.15 0.10 4 0.40 3 0.30 2 0.20 1.00 3.53 2.47 1.81 Disney is substantially better than either CBS or Carnival, being more diversified and having substantially more revenues. EFE Matrix Weight Rating Weighted Score 0.04 3 0.12 1. 0.04 4 0.16 0.04 1 0.04 0.05 1 0.05 Opportunities There has been a 5.8% increase in amusement park attendance worldwide. 2. The United States is expected to see a 10% increase in population growth over the next 10 years. 3. Recent issues with Carnival Cruise ships mechanical malfunctions are leaving many customers looking for a new cruise line. 4. Texas has a population of over 26 million, is half way between Disney parks in California and Florida and an easy drive from Mexico. 3D Box Office films are up 40% from 4 years ago. 6. Mobile app market games have seen over 3 billion downloads and games can be brought to market in half the time it takes to provide for a console system. 7. Online movie rentals are up 41% in 2012. 8. People are increasingly spending more time at home watching larger screen TVs. 9. Increasing use of smart phones with over 50% of the population in Europe and the USA owning a smart phone. 10. The new college football playoff TV rights are available for bidding. 5. 2 0.10 0.05 0.03 3 0.09 0.05 3 3 0.15 0.09 0.03 0.03 3 0.09 0.05 4 0.20 Weight Rating Weighted Score 0.05 3 3 0.15 0.11 3 0.33 3 0.06 3 0.18 4 0.07 2 0.14 0.08 3 3 0.24 0.03 3 3 0.09 Threats 1. College conference realignments allow conferences to exit TV contracts and sign new more lucrative TV contracts. 2 Disney competes directly with NBC Universal, Paramount Pictures, and CBS for TV entertainment and sports. Camival Cruise Line reported revenues of 15.38 billion compared to Disney Parks and Resorts revenue of 12.9 billion in 2012. There are many competing theme parks spread across the USA and world with most having lower prices than Disney. 5. Piracy in the Film and Music Industry. 6. Strikes in professional sports could severely impact revenues for ABC and ESPN. U.S. consumer spending on DVDs was down about 20% in 2010 1. from 2009, to $7.8 billion. That was 43% below a 2006 peak of $13.7 billion. 8. Unemployment and gas prices both remain high around the world. f 9. Universal Studios, Island of Adventure, and Wizarding World of Harry Potter has reported an increase of 1.725 million in attendance over the past year. 10. People in the developed world are having fewer children and waiting later in life to have kids. TOTALS 0,04 2 0.08 0.03 4 0.12 0.06 3 0.18 0.06 2 0.12 1.00 2.72 Disney has an above average EFE score of 2.72. E. Internal Audit Strengths 1. Disney owns ABC, ESPN, Walt Disney Studios, and Pixar among other media outlets. 2. Disney owns theme parks in the USA, Japan, France, and Hong Kong. The firm also owns Disney Cruise Line. 3. Net income rose 18% in fiscal 2012. 4. Media Networks segment accounted for 45% of 2012 revenues and 67% of income. 5. Parks and Resorts segment accounted for 31% of 2012 revenues and 15% of income. 6. Studio Entertainment produces Spider-man, The Fantastic Four, X-Men. This segment experienced revenues declining 8% and income increasing 17% in 2012. 7. Disney channels worldwide consist of 94 kids channels; Disney's profit margin ratio (12.40) is almost half the industry's (22.40). Family entertainment channels available in 169 nations and 33 languages. 8. Out of the top 25 amusement/theme parks worldwide, Disney holds 11 of the spots with 8 of them being in the top 10. 9. Debt to Equity ratio of 0.4 suggests Disney is using debt to finance at an appropriate level while revenues have increased for 9 of the last 10 years. 10. ESPN agreed to $15.2 billion, 8-year contract, with NFL "Monday Night Football." Weaknesses 1. Interactive Media, which delivers games to smartphones, has reported negative net income for each of the last three years. 2. The firm has over $25 billion in goodwill accounting for 1/3 of total assets. 3. The firm has $2.5 billion of works-in-progress and is attempting to manage the building of the new park in Shanghai and integrating the new acquisition of Lucasfilm. 4. The firm's revenue/employee is roughly half that of the industry average. 5. Theme park attendance increased only 3% in 2012, and 1% in 2011; revenues generated from international theme parks are lagging substantially behind domestic theme parks. 6. Walt Disney currently only has 4 cruise ships. 7. Disney's gross margin is 21% with the industry average being 31%. 8. Disneyland Paris saw operating income decrease by 25%. 9. Disney DVD market down 25% in unit sales. 10. Many of Disney's parks traditional attractions have not received meaningful upgrades in decades. Financial Ratio Analysis Disney 21.18 Profit Margin Percent Gross Margin Pre-Tax Margin Net Profit Margin Industry 30.99 19.86 14.37 S&P 500 38.38 16.81 12.45 21.58 14.82 Liquidity Ratios Debt/Equity Ratio Current Ratio Quick Ratio 0.4 1.1 1 0.56 1.4 1.2 1.11 1.4 1 I Profitability Ratios Return On Equity Return On Assets Return On Capital 14.9 8.3 10.3 14.98 7.6 9.4 22.69 7.6 10 Efficiency Ratios Income/Employee Revenue/Employee Receivable Turnover Inventory Turnover Asset Turnover 39,066 263,645 6.5 23.7 0.6 77,063 553,013 5.7 15.5 0.5 125,200 1.04 Mil 13.9 13.3 0.8 Disney is doing well financially on all the ratios presented above. The only area where Disney lags the industry average is on revenue/employee which is half that of the industry average. Net Worth Analysis in millions) Disney Company Worth Analysis Stockholders' Equity - (Goodwill+Intangibles) Net Income x5 (Share Price/EPS) x Net Income Number of Shares Outstanding x Share Price Method Average $5,144 S29,850 $116,678 S115,740 $66,853 CBS Company Worth Analysis Stockholders' Equity - (Goodwill + Intangibles) Net Income x5 (Share Price/EPS) x Net Income Number of Shares Outstanding x Share Price Method Average $11,384 $8.650 $32.257 S29.079 $20,343 Using methods 3 and 4, Disney is worth nearly four times CBS. However, using method one which takes into account goodwill and intangibles, CBS is worth over twice Disney. IFE Matrix 4 0.20 4 4 Strengths Weight Rating Weighted Score 1. Disney owns ABC, ESPN, Walt Disney Studios, and Pixar among Jother media outlets. 0.09 4 0.36 12. Disney owns the Walt Disney Theme parks in the USA, Japan, 0.05 France, and Hong Kong. The fimm also owns Disney Cruise Line. 3. Net income rose 18% in fiscal 2012. 0.07 0.28 4. Media Networks segment accounted for 45% of 2012 revenues 0.05 0.20 and 67% of income. 5. Parks and Resorts segment accounted for 31% of 2012 revenues 0.05 4 0.20 and 15% of income. % . 6. Studio Entertainment produces Spider-man, The Fantastic Four, X-Men. This segment experienced revenues declining 8% and 0.05 3 0.15 income increasing 17% in 2012, f 7. Disney channels world wide consists of 94 kids and Disney's profit margin ratio (12.40) is almost half of the industry's (22.40). 0.05 4 0.20 Family entertainment channels available in 169 nations and 33 languages. 8. Out of the top 25 amusement/theme parks worldwide, Walt 0.05 4 4 Disney holds 11 of the spots with 8 of them being in the top 10. 0.20 Debt to Equity ratio of 0.4 suggesting Disney is using debt to finance at an appropriate level while revenues have increased for 0.06 4 0.24 19 of the last 10 years. 10. ESPN agreed to $15.2 billion, 8-year contract, with NFL "Monday 0.06 4 0.24 Night Football." + 4 Weight Rating Weighted Score 0.03 a 2 0.06 2 0.04 1 0.04 0.04 2 2 0.08 0.02 1 0.02 Weaknesses Interactive Media segment which delivers games to smart phones has reported negative net income for cach of the last three years. . The firm has over $25 billion in goodwill accounting for 1/3 of total assets. . The firm has $2.5 billion of works in progress and is attempting to manage the building of the new park in Shanghai and facilitating the new acquisition of Lucasfilm for over $4billion. 4. The firm's revenue/employee is roughly half that of the industry average 5. Theme park attendance increased only 3% in 2012, and 1% in 2011. With revenues generated from international theme parks lagging substantially behind domestic theme parks. 6. Walt Disney currently only has 4 cruise ships. 7. Disney's gross margin is 21% with the industry average being 31%. 8. Disneyland Paris saw operating income decrease by 25%. 9. Disney DVD market down 25% in unit sales. 10. Many of Disney's parks traditional attractions have not received meaningful upgrades in decades. TOTALS 0.04 1 0.04 0.04 2 0.08 0.05 2 2 0.10 1 0.04 0.04 0.04 0.04 1 0.08 1 0.08 1.00 2.85 Disney is performing better than average on internal issues with an IFE score of 2.85. Disney is capitalizing well on their strengths; however, several weaknesses are major in particular the $25 billion in goodwill and the lack of upgrading many of the parks traditional attractions. F. SWOT SO Strategies 1. Build a new theme park in Houston, Texas by 2015 for $1 billion (S2, S3, S5, S9, 02, 04). 2. Sign an exclusive 10-year contract to cover the new college football playoff starting in 2014 for $1 billion (S1, S3, S4, S9, S10, 02, 08, 010). 3. Add an additional 5 cruise ships to the fleet at a cost of $600 million each (S2, S9, 02, 03). WO Strategies 1. Add an additional 5 cruise ships to the fleet at a cost of $600 million each (W6, 02, 03). 2. Partner with Netflix to better provide on demand movies for customers (W7, W9, 07, 08). ST Strategies 1. Sign a 10-year deal with the ACC to broadcast their games on ESPN and ABC for $1 billion (S1, S10, T1). 2. Add an additional 5 cruise ships to the fleet at a cost of $600 million each (S2, S9, T3). WT Strategies 1. Spend $1 billion to upgrade traditional attractions at Disney parks world wide (W5, W10, T3, T4, T9). 2. Spend $1 billion to develop a new parks at existing park locations targeted at people without children living at home (W5, W6, W8, W10 110) G. SPACE Matrix FP Conservative Aggressive 7 6 5 4 3 2 X-2.4 Y-1.6 1 CP IP -7 -6 -5 4 -2 -1 1 2 3 4 5 6 7 - 1 -2 -3 -5 -6 -7 Defensive Competitive SP Internal Analysis: Financial Position (EP) Revenue Goodwill Impairment Net Worth Debt to Equity Diversification Financial Position (FP) Average External Analysis: Stability Position (SP) 7 Threat of Movie Piracy 2 Technological Changes 7 Rising Fuel Prices 6 Competitive Pressure 6 Barriers to Entry into Market 5.6 Stability Position (SP) Average -4.0 5 Internal Analysis: Competitive Position (CP) Market Share Product Quality Customer Loyalty Technological know-how Brand Recognition Competitive Position (CP) Average External Analysis: Industry Position (IP) Growth Potential Financial Stability Ease of Entry into Market Threat of Substitute Products Reliance on Disposable Income -2.0 Industry Position (IP) Average 6 6 2 3 4.4 Disney is well positioned in the Aggressive Quadrant and perhaps should add a theme park in Texas and expand its fleet of cruise boats. H. Grand Strategy Matrix Rapid Market Growth Quadrant II Quadrant I Weak Competitive Position Strong Competitive Position Quadrant III Quadrant IV Slow Market Growth Disney is in a strong competitive position, but the overall market is experiencing modest growth. Taking advantage of the growing trend of people watching sporting events from home, Disney's ESPN/ABC branch should form further contracts with the SEC, ACC and NFL for the rights to broadcast these events. I. The Internal-External (IE) Matrix Strong 4.0 to 30 4.0 The Total IFE ignted Scores Average 2.99 to 2.0 II Weak 1.99 to 1.0 III High 1 3.0 IV VI Disney 2 The EFE Total Medium Weighted Scores VII VIII LX 3 4 Low 1.0 Segment (1) Media Networks (2) Parks and Resorts (3) Studio Entertainment (4) Consumer Products (4) Interactive Media Totals Total Sales $19,426 12,920 5,825 3,252 845 42,278 2012 (in millions) Total Income $6,619 1,902 722 937 (216) 9,964 % Income 66% 19 7 9 -2 100 J. OSPM Focus on Upgrade and Media, in Build New Particular Theme Parks Sports Broadcasting Weight AS TAS AS TAS 0.04 4 0.16 1 0.04 0.04 2 0.08 3 3 0.12 0.04 0 0 0.00 0 0.00 0.05 4 0.20 1 1 0.05 Opportunities 1. There has been a 5.8% increase in amusement park attendance worldwide. The United States is expected to see a 10% increase in population growth over the next 10 years. 3. Recent issues with Carnival Cruise ships mechanical malfunctions are leaving many customers looking for a new cruise line. 4. Texas has a population of over 26 million, is half way between Disney parks in California and Florida and an easy drive from Mexico. 3D Box Office films are up 40% from 4 years ago. 6. Mobile app market games have seen over 3 billion downloads and games can be brought to market in half the time it takes to provide for a console system 7. Online movie rentals are up 41% in 2012. 8. People are increasingly spending more time at home watching larger screen TVs 9. Increasing use of smart phones with over 50% of the population in Europe and the USA owning a smart phone. 10. The new college football playoff TV rights are available for bidding. 0.05 1 0.05 2 0.10 0.03 0 0.00 0 0.00 0.05 1 0.05 2 2 0.10 0.03 1 0.03 2 0.06 0.03 0 0.00 0 0.00 0.05 1 0.05 4 0.20 TAS AS TAS 0.05 4 0.20 0.11 3 0.33 0.00 0 0.00 : : 4 0.28 0.07 1 0.08 Threats Weight AS 1. College conference realignments allow conferences to exit TV 0.05 1 contracts and sign new more lucrative TV contracts. 2. Disney competes directly with NBC Universal, Paramount 0.11 1 Pictures, and CBS for TV entertainment and sports. 3. Carnival Cruise Line reported revenues of 15.38 billion compared 0.06 0 0 to Disney Parks and Resorts revenue of 12.9 billion in 2012. 4. There are many competing theme parks spread across the USA 0.07 and world with most having lower prices than Disney. 5. Piracy in the Film and Music Industry. 0.08 6. Strikes in professional sports could severely impact revenues for 0.03 1 ABC and ESPN. 7. U.S.consumer spending on DVDs was down about 20% in 2010 from 2009, to $7.8 billion. That was 43% below a 2006 peak of 0.04 1 $13.7 billion. 8. Unemployment and gas prices both remain high around the 0 world. 9. Universal Studios, Island of Adventure, and Wizarding World of Harry Potter has reported an increase of 1.725 million in 0.06 4 attendance over the past year. 10. People in the developed world are having fewer children and 0.06 0 waiting later in life to have kids. - * 0.16 0.03 4 4 0.12 0.04 2 0.08 0.03 0.00 0 0.00 * 0.24 1 0.06 0 0.00 0 0.00 4 3 and 67% of income. Focus on Upgrade and Media, in Build New Particular Theme Parks Sports Broadcasting Strengths Weight AS TAS AS TAS Disney owns ABC, ESPN, Walt Disney Studios, and Pixar among 0.09 1 0.09 0.36 other media outlets. Disney owns the Walt Disney Theme parks in the USA, Japan, 0.05 3 0.15 1 0.05 France, and Hong Kong. The firm also owns Disney Cruise Line. Net income rose 18% in fiscal 2012. 0.07 0.21 2 0.14 4. Media Networks segment accounted for 45% of 2012 revenues 0.05 1 0.05 3 0.15 5. Parks and Resorts segment accounted for 31% of 2012 revenues 0.05 4 0.20 1 0.05 and 15% of income. 6. Studio Entertainment produces Spider-man, The Fantastic Four, X-Men. This segment experienced revenues declining 8% and 0.05 1 0.05 2 0.10 income increasing 17% in 2012. Disney channels world wide consists of 94 kids and Disney's 0,05 1 profit margin ratio (12.40) is almost half of the industry's (22.40). 0.05 2 0.10 8. Out of the top 25 amusement/theme parks worldwide, Walt 0.05 0.20 0.05 Disney holds 11 of the spots with 8 of them being in the top 10. 9. Debt to Equity ratio of 0.4 suggesting Disney is using debt to finance at an appropriate level while revenues have increased for 0.06 0.18 0.12 9 of the last 10 years. 10. ESPN agreed to $15.2 billion, 8-year contract, with NFL Monday 0.06 1 Night Football." 0.06 0.24 4 1 a 2 4 4 Weight AS TAS AS TAS 0.03 0 0.00 0 0 0.00 0.04 0 0.00 0 0.00 0.04 0 0.00 0 0 0.00 14 0.02 0 0.00 0 0.00 Weaknesses Interactive Media segment which delivers games to smart phones has reported negative net income for each of the last three years twee years The firm has over $25 billion in goodwill accounting for 1/3 of total assets. The firm has $2.5 billion of works in progress and is attempting to manage the building of the new park in Shanghai and facilitating the new acquisition of Lucasfilm for over $4billion. The firm's revenue/employee is roughly half that of the industry average. Theme park attendance increased only 3% in 2012, and 1% in 2011. With revenues generated from international theme parks lagging substantially behind domestic theme parks. . Walt Disney currently only has 4 cruise ships Front 17. Disney's gross margin is 21% with the industry average being 31%. Disneyland Paris saw operating income decrease by 25% 9. Disney DVD market down 25% in unit sales 10. Many of Disney's parks traditional attractions have not received meaningful upgrades in decades. TOTALS 0.04 4 0.16 1 0.04 0.04 0 0.00 0 0.00 0.05 0 0.00 0 0.00 3 0.04 0.04 0.12 0.00 1 0 0.04 0.00 0 0.08 4 0.32 1 0.08 3.29 3.21 Both strategies of the QPSM are equally attractive for Disney. With the capital resources Disney has at their disposal, building a new Disney park in Houston, Texas, upgrading all existing Disney parks, and working to solidify contracts for both college and pro sports are all equally attractive alternatives - and perhaps could be implemented simultaneously. K. Recommendations 1. Build a new theme park in Houston, Texas by 2015 for $1 billion. 2. Sign an exclusive 10 year contract to cover the new college football playoff starting in 2014 for $1 billion. 3. Add an additional 5 cruise ships to the fleet at a cost of $600 million each. 4. Partner with Netflix to better provide on demand movies for customers for $10 million. 5. Sign a 10 year deal with the ACC to broadcast their games on ESPN and ABC for $1 billion. 6. Spend $1 billion to upgrade traditional attractions at Disney parks worldwide. 7. Spend $1 billion to develop new parks at existing park locations targeted at people without children living at home. L. EPS/EBIT Analysis (in millions expect for EPS and Share Price) Amount Needed: $8,000M Stock Price: $64.30 Shares Outstanding: 1,800 Interest Rate: 3% Tax Rate: 33% EBIT Interest EBT Taxes EAT # Shares FPS Common Stock Financing Recession Normal Boom $8,000 $10,000 $12,000 0 0 0 8,000 10,000 12,000 2,640 3,300 3,960 5,360 6,700 8,040 1,924 1,924 1,924 2.79 3.48 4.18 Recession $8.000 240 7,760 2.561 5,199 1,800 2.89 Debt Financing Normal $10,000 240 9,760 3,221 6,539 1,800 3.63 Boom $12,000 240 11,760 3,881 7,879 1,800 4.38 EBIT Interest EBT Taxes EAT # Shares Recession $8,000 180 7,820 2,581 5,239 1,831 2.86 25 Percent Stock Normal $10,000 180 9,820 3,241 6,579 1,831 3.59 Boom $12,000 180 11,820 3,901 7,919 1,831 4.32 75 Percent Stock Recession Normal $8,000 $10,000 60 60 7,940 9.940 2,620 3,280 5.320 6,660 1,893 1,893 2.81 3.52 Boom $12,000 60 11,940 3,940 8.000 1,893 4.23 EPS The EPS/EBIT Analysis reveals that debt financing is more attractive for Disney under all economic conditions. M. Epilogue In mid-2013, Disney raised its one-day theme park ticket prices at both its California and Florida theme parks. A one-day pass to see Disney's Magic Kingdom went from $89 to $95. Tickets to see Disney's other three Florida parks increased to $90. The increased Disney prices came right after SeaWorld (NYSE: SEAS) and Comcast's (NASDAQ: CMCSK) Universal Orlando increased their ticket prices. California Adventure recently completed a $1.1 billion expansion and led the world's largest theme parks with a 23 percent surge in visitors to 7.78 million in 2012. Attendance during 2012 at the top 25 theme parks worldwide increased 5.2 percent to 205.9 million visitors. However, just down the road, Disney's California Disneyland was the only park among the world's largest to register fewer visitors in 2012, with attendance shrinking 1.1 percent to 16 million. . Disney's net income increased 32 percent to $1.51 billion in its Q2 of 2013, in part due to higher attendance. For its Q2 of 2013, Disney reported revenue of $10.4 billion, down from $11.3 billion the prior quarter. Disney owns 80 percent of ESPN, and ESPN is the most profitable of all Disney properties. ESPN is available in over 100 million American homes, approximately 1/3 of the USA population. ESPN recently cut 300 to 400 jobs too lower costs, but at the same time acquired the rights to show U.S. Open Tennis matches and is beginning a new channel for SEC Football, Chapter 8: Walt Disney 10 Basic Questions 1: 2: 3 4: A D 5: B 6: 7: 8: B 9: 10: D 15 Applied Questions Boston Consulting Group (BCG) and Internal-External (IE) Matrices 1: B 2: D 3: 4: B 5: D Resource-Based View 1: B 2: 3: B 4: B 5: Internal Factor Evaluation (IFE) Matrix 1: A 2: 3: 4: A 5: AStep by Step Solution
There are 3 Steps involved in it

Get step-by-step solutions from verified subject matter experts