

Question: For the case study: exit 53 WMA Fast Lane Toll System (textbook p482) Using the case data given (Links to an external site.), please create
For the case study: exit 53 WMA Fast Lane Toll System (textbook p482)
Using the case data given (Links to an external site.), please create a p-chart and answer the following questions:
Please keep 5-decimal in all the answers below.
1. What is the sample size in the study?
2. What is the value of p-bar?
3. What is the upper control limit for p-bar?
4. What is the lower control limit for p-bar?
5. Does the p-chart indicate the current system is in control?
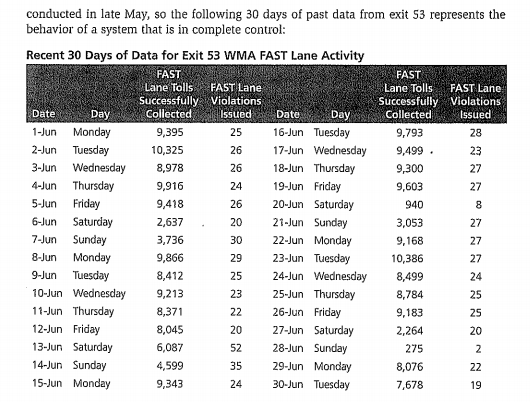
conducted in late May, so the following 30 days of past data from exit 53 represents the behavior of a system that is in complete control: Recent 30 Days of Data for Exit 53 WMA FAST Lane Activity FAST FAST Lane Tolls FAST Lane Lane Tolls FAST Lane Successfully Violations Successfully Violations Date Day Collected Issued Date Day Collected Issued 1-Jun Monday 9,395 25 16-Jun Tuesday 9,793 28 2-Jun Tuesday 10,325 26 17-Jun Wednesday 9,499 23 3-Jun Wednesday 8,978 26 18-Jun Thursday 9,300 27 4-Jun Thursday 9,916 24 19-Jun Friday 9,603 27 5-Jun Friday 9,418 26 20-Jun Saturday 940 8 6-Jun Saturday 2,637 20 21-Jun Sunday 3,053 27 7-Jun Sunday 3,736 30 22-Jun Monday 9,168 27 8-Jun Monday 9,866 29 23-Jun Tuesday 10,386 27 9-Jun Tuesday 8,412 25 24-Jun Wednesday 8,499 24 10-Jun Wednesday 9,213 23 25-Jun Thursday 8,784 25 11-Jun Thursday 8,371 22 26-Jun Friday 9,183 25 12-Jun Friday 8,045 20 27-Jun Saturday 2,264 20 13-Jun Saturday 6,087 52 28-Jun Sunday 275 2 14-Jun Sunday 4,599 35 29-Jun Monday 8,076 22 15-Jun Monday 9,343 24 30-Jun Tuesday 7,678 19Step by Step Solution
There are 3 Steps involved in it
1 Expert Approved Answer
Step: 1 Unlock

Question Has Been Solved by an Expert!
Get step-by-step solutions from verified subject matter experts
Step: 2 Unlock
Step: 3 Unlock