

Question: For the circuit given in Figure 2 , draw V i n 1 and V o u t voltages versus time on the same graph.
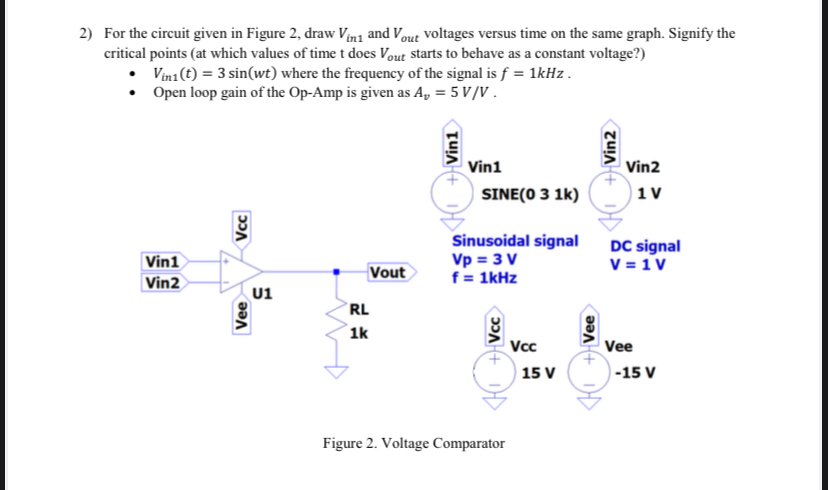
For the circuit given in Figure draw and voltages versus time on the same graph. Signify the critical points at which values of time does starts to behave as a constant voltage?
where the frequency of the signal is
Open loop gain of the OpAmp is given as
Sinusoidal signal signal
Figure Voltage Comparator
Step by Step Solution
There are 3 Steps involved in it
1 Expert Approved Answer
Step: 1 Unlock

Question Has Been Solved by an Expert!
Get step-by-step solutions from verified subject matter experts
Step: 2 Unlock
Step: 3 Unlock