

Question: For the cross-tabulation data shown below, which represents a count of the type of books that individuals prefer, verify that the assumptions of the chi-square
For the cross-tabulation data shown below, which represents a count of the type of books that individuals prefer, verify that the assumptions of the chi-square test are not met, and aggregate the data in an appropriate way so that the assumptions are met. Then conduct a chi-square test for independence at the 0.05 level of significance.
| Gender | Fiction | Nonfiction | Romance | Autobiography |
| Male | 10 | 2 | 2 | 6 |
| Female | 7 | 5 | 2 | 0 |
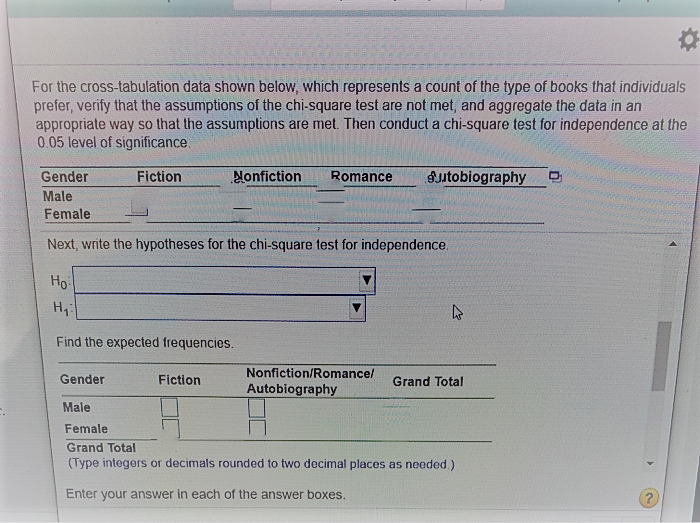
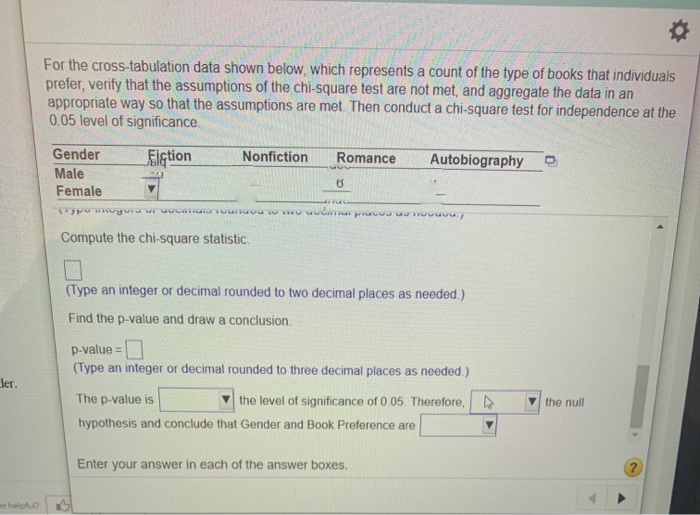
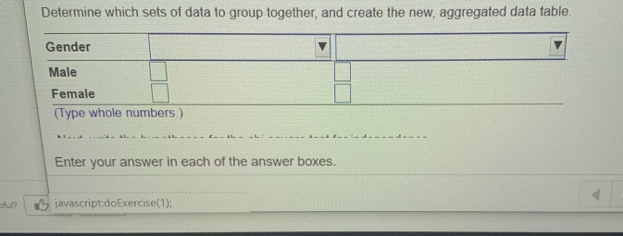
For the cross-tabulation data shown below, which represents a count of the type of books that individuals prefer, verify that the assumptions of the chi-square test are not met, and aggregate the data in an appropriate way so that the assumptions are met. Then conduct a chi-square test for independence at the 0.05 level of significance Gender Fiction Nonfiction Romance autobiography Male Female Next, write the hypotheses for the chi-square test for independence Ho Hy : Find the expected frequencies. Gender Fiction Nonfiction/Romance/ Grand Total Autobiography Male Female Grand Total (Type integers or decimals rounded to two decimal places as needed. ) Enter your answer in each of the answer boxes. ?For the cross-tabulation data shown below, which represents a count of the type of books that individuals prefer, verify that the assumptions of the chi-square test are not met, and aggregate the data in an appropriate way so that the assumptions are met. Then conduct a chi-square test for independence at the 0.05 level of significance. Gender Fiction Nonfiction Romance Autobiography Male Female Compute the chi-square statistic. (Type an integer or decimal rounded to two decimal places as needed.) Find the p-value and draw a conclusion. p-value = ] (Type an integer or decimal rounded to three decimal places as needed.) ler The p-value is the level of significance of 0.05. Therefore, the null hypothesis and conclude that Gender and Book Preference are Enter your answer in each of the answer boxes. er helphun?Determine which sets of data to group together, and create the new, aggregated data table Gender Male Female (Type whole numbers.) bleed tie it - L.. Enter your answer in each of the answer boxes. atul? javascript:doExercise(1)
Step by Step Solution
There are 3 Steps involved in it

Get step-by-step solutions from verified subject matter experts