

Question: For the cross-tabulation data shown below, which represents a count of the type of books that individuals prefer, verify that the assumptions of the chi-square
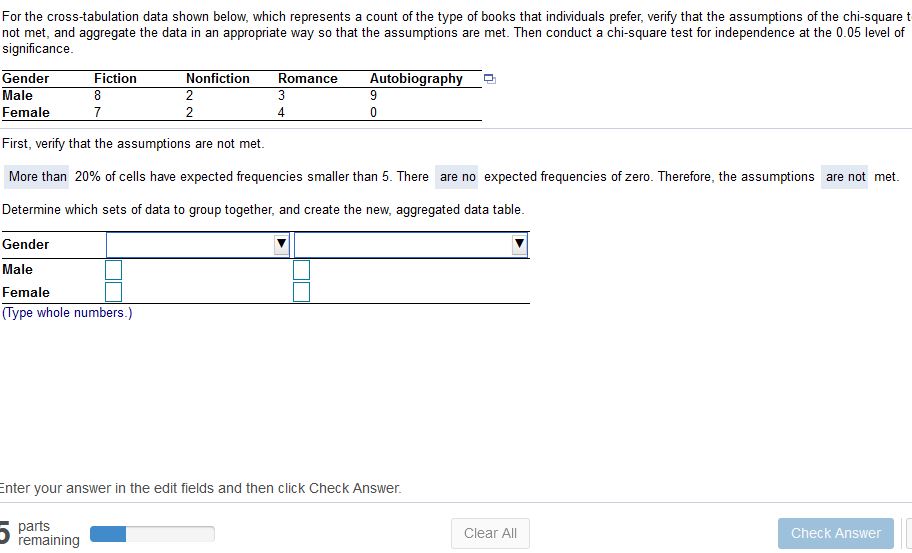
For the cross-tabulation data shown below, which represents a count of the type of books that individuals prefer, verify that the assumptions of the chi-square t not met, and aggregate the data in an appropriate way so that the assumptions are met. Then conduct a chi-square test for independence at the 0.05 level of signicance. Gender Fiction Nonction Romance Autobiography % Male 3 2 3 9 Female 7 2 4 U First, verify that the assumptions are not met. More than 20% ofcells have expected frequencies smaller than 5. There are no expected frequencies of zero. Therefore, the assumptions are not met. Determine which sets of data to group together, and create the new, aggregated data table. Gender | Male |: |: Female I: I: (Type whole numbers.) Enter your answer in the edit elds and then click Check Answer. F Dam - 3 remaining Clear All Check
Step by Step Solution
There are 3 Steps involved in it

Get step-by-step solutions from verified subject matter experts