

Question: For the data as stated in Table 1. #wer the questions that follow: 0.2 4.1 3.5 4.5 3.2 3.7 | 3.0 2.6 3.4 1.6 3.1
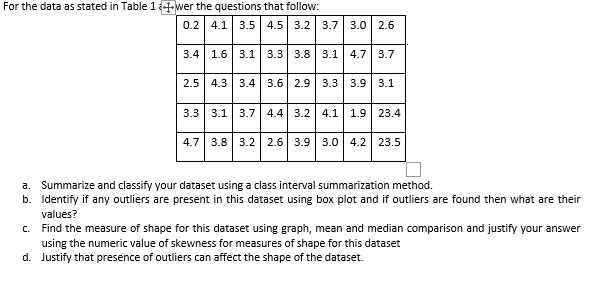
For the data as stated in Table 1. #wer the questions that follow: 0.2 4.1 3.5 4.5 3.2 3.7 | 3.0 2.6 3.4 1.6 3.1 3.3 3.8 3.1 4.7 3.7 2.5 4.3 3.4 3.6 2.9 3.3 3.9 3.1 3.3 3.1 3.7 4.4 3.2 4.1 1.9 23.4 4.7 3.8 3.2 2.6 3.9 3.0 4.2 23.5 a. Summarize and classify your dataset using a class interval summarization method. b. Identify if any outliers are present in this dataset using box plot and if outliers are found then what are their values? c. Find the measure of shape for this dataset using graph, mean and median comparison and justify your answer using the numeric value of skewness for measures of shape for this dataset d. Justify that presence of outliers can affect the shape of the dataset. For the data as stated in Table 1. #wer the questions that follow: 0.2 4.1 3.5 4.5 3.2 3.7 | 3.0 2.6 3.4 1.6 3.1 3.3 3.8 3.1 4.7 3.7 2.5 4.3 3.4 3.6 2.9 3.3 3.9 3.1 3.3 3.1 3.7 4.4 3.2 4.1 1.9 23.4 4.7 3.8 3.2 2.6 3.9 3.0 4.2 23.5 a. Summarize and classify your dataset using a class interval summarization method. b. Identify if any outliers are present in this dataset using box plot and if outliers are found then what are their values? c. Find the measure of shape for this dataset using graph, mean and median comparison and justify your answer using the numeric value of skewness for measures of shape for this dataset d. Justify that presence of outliers can affect the shape of the dataset
Step by Step Solution
There are 3 Steps involved in it

Get step-by-step solutions from verified subject matter experts