

Question: Table : Car Battery Life 2.2 4.1 3.5 4.5 3.2 3.7 3.0 2.6 3.4 1.6 3.1 3.3 3.8 3.1 4.7 3.7 2.5 4.3 3.4 3.6
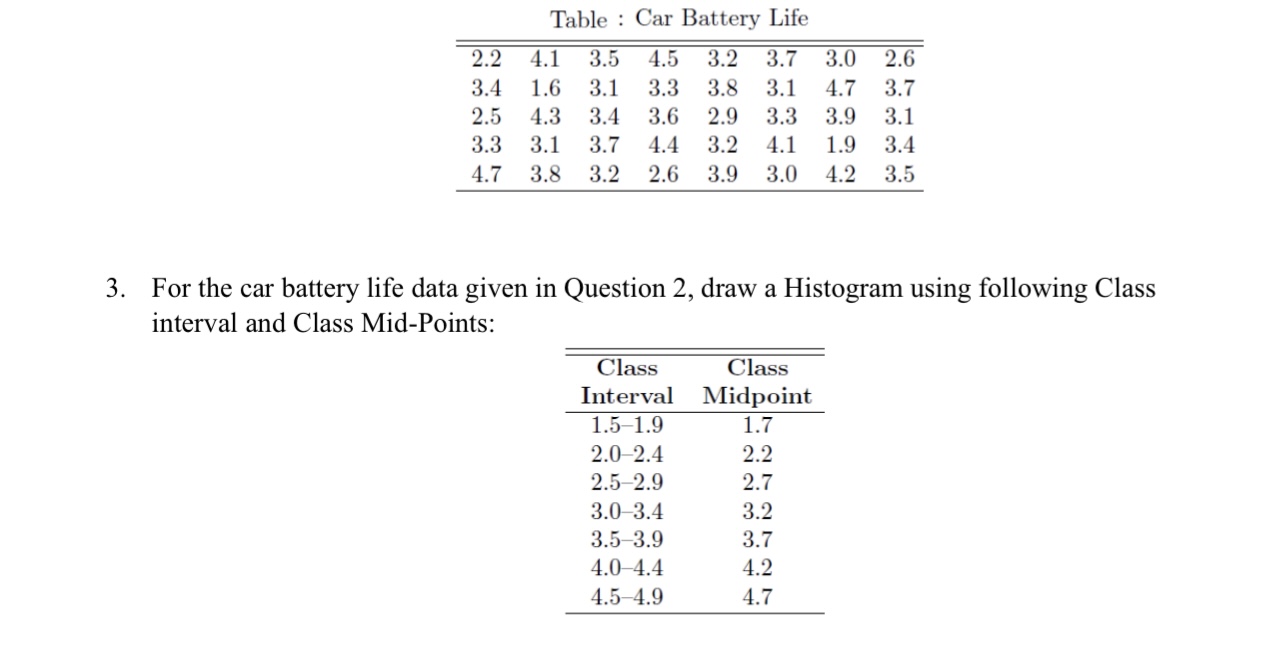
Table : Car Battery Life 2.2 4.1 3.5 4.5 3.2 3.7 3.0 2.6 3.4 1.6 3.1 3.3 3.8 3.1 4.7 3.7 2.5 4.3 3.4 3.6 2.9 3.3 3.9 3.1 3.3 3.1 3.7 4.4 3.2 4.1 1.9 3.4 4.7 3.8 3.2 2.6 3.9 3.0 4.2 3.5 3. For the car battery life data given in Question 2, draw a Histogram using following Class interval and Class Mid-Points: Class Class Interval Midpoint 1.51.9 1.7 2.02.4 2.2 2.572.?) 2.7 3.03.4 3.2 3.53.9 3.7 4.04.4 4.2 4.54.9 4.7
Step by Step Solution
There are 3 Steps involved in it
1 Expert Approved Answer
Step: 1 Unlock

Question Has Been Solved by an Expert!
Get step-by-step solutions from verified subject matter experts
Step: 2 Unlock
Step: 3 Unlock