

Question: For the data below: a) Develop a scatter diagram (14 Marks). b) Develop a five-year moving average ferecast (1s Marks) [32] Question 2 A marketing
![b) Develop a five-year moving average ferecast (1s Marks) [32] Question 2](https://dsd5zvtm8ll6.cloudfront.net/si.experts.images/questions/2024/10/671afd1e22bc0_981671afd1d72a46.jpg)
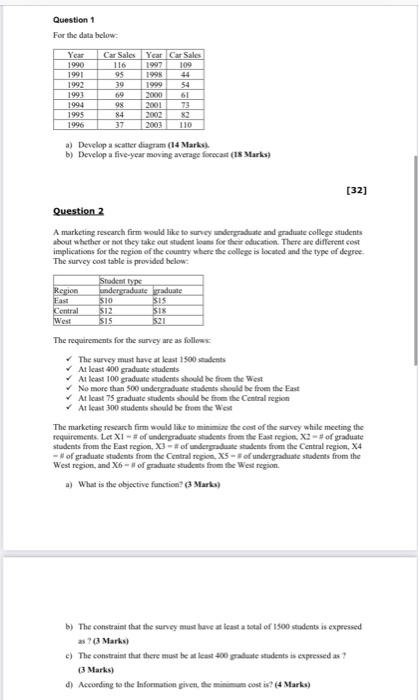
For the data below: a) Develop a scatter diagram (14 Marks). b) Develop a five-year moving average ferecast (1s Marks) [32] Question 2 A marketing rescanch firm would like to suncy undergraduate and gradiate college students about whether of not they take out student houns for their obucation. There ate different cost inglicaticens for the region of the country where the college is located and the type of deyreeThe survey cost table is provided below: The requirements for the survey are as follewe The survey must hive at least 1500 sodents At least 400 graduate students. At least 100 graduate inadents should be froe the West No more than 500 undergraduate students stoveld be from the East At least 75 graduate students should be fiven Ble Central region At least 300 students should be from the Wee The marketing rescarch firm woeld like to minimise the cost of the sarvey while meeting the students from the East region, X3 - If of undergruduite stodents from the Central region, X4 -ill of graduate stadents from the Central region. X5 - I of underyraduate students from the West region, and X6 - If of graduate students frum the West region. a) What is the objective function? (3 Marks) b) The cotstraiat that the survey must luve at least a sotal of 1500 itudents is expersed as ? (3 Marks) c) The constraiat that there must be at least 400 praluate itudents is expressed as ? (3 Marks) d) Accoeding to the lnfornation given Ate miningm cost is? (4 Mtarks) Question 3 a) Bugs of chocolate candy are sampled to ensure proper weight. The overall average for the samples is 36 ounces. Each sample contains twelve bags. The average range is 13 ounces. The upper control chart limit for the sample averages would be? (2 Marks) b) Bags of checolate candy are sampled to ensure proper weight. The overall average for the samples is 36 ounces. Each sample contains eight bags. The average range is 1.3 ounces. The lower control chart limis for the sample averages would be? (2 Marks) c) To guarantec that cans of socy are properly filled, some cans are sampled and the amounts measured. The overall average for the samples is 12 ounces. Each sample contains 10 cans. The average range is 0.4 ounces. The upper control chart limit for the sample averages would be? (2 Marks) d) To guarantee that cans of soda are properly filled, some cans are sampled and the amounts measured. The overall average for the samples is 12 ounces. Fach sample contains to cans. The average range is 0.4 eances. The lower coetrol clart timit for the sample averages would be? (2 Marks) e) Bags of tea are sampled to ensure proper weight. The overall average for the samples is 8 cunces. Each saraple contains 10 bags. The average range is 0.1 ounces. What is the lower limit of the sample averages chart? (2 Marks) f) The Pristine Paint Company produces paint in galloe cans. They have found that in more than 10 samples of 8 cans each, the average gallon can contains 1.1 gallons of paint. The average range found ever these sumples is 0.15 gallons. What is the opper control limit for the sample averages in this process? (2 Marks) g) The average range of a process for packaging cercal is 1.1 ounces, If the sample size is 10 , find the upper control chart limit for the range chart (2 Marks) h) The average range of a process for packaging cereal is 1.1 ounces. If the sample sire is 10, find the lower control chart limit for the range chart. (2 Marks)
Step by Step Solution
There are 3 Steps involved in it

Get step-by-step solutions from verified subject matter experts