

Question: Question 1 For the data below: a) Develop a scatter diagram (14 Marks). b) Develop a five-year moving average forecast (18 Marks) begin{tabular}{|c|c|c|c|} hline Year
Question 1 For the data below:
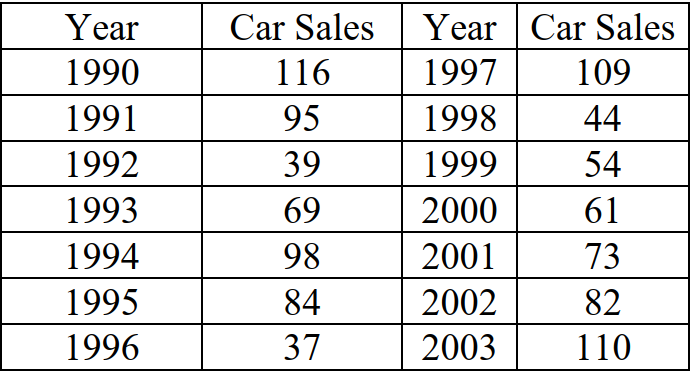
a) Develop a scatter diagram (14 Marks). b) Develop a five-year moving average forecast (18 Marks)
\begin{tabular}{|c|c|c|c|} \hline Year & Car Sales & Year & Car Sales \\ \hline 1990 & 116 & 1997 & 109 \\ \hline 1991 & 95 & 1998 & 44 \\ \hline 1992 & 39 & 1999 & 54 \\ \hline 1993 & 69 & 2000 & 61 \\ \hline 1994 & 98 & 2001 & 73 \\ \hline 1995 & 84 & 2002 & 82 \\ \hline 1996 & 37 & 2003 & 110 \\ \hline \end{tabular}
Step by Step Solution
There are 3 Steps involved in it
1 Expert Approved Answer
Step: 1 Unlock

Question Has Been Solved by an Expert!
Get step-by-step solutions from verified subject matter experts
Step: 2 Unlock
Step: 3 Unlock