

Question: For the data given below plot and provide the requested answers. Make predictions ranges at a temperature of 190 of both an individual value and

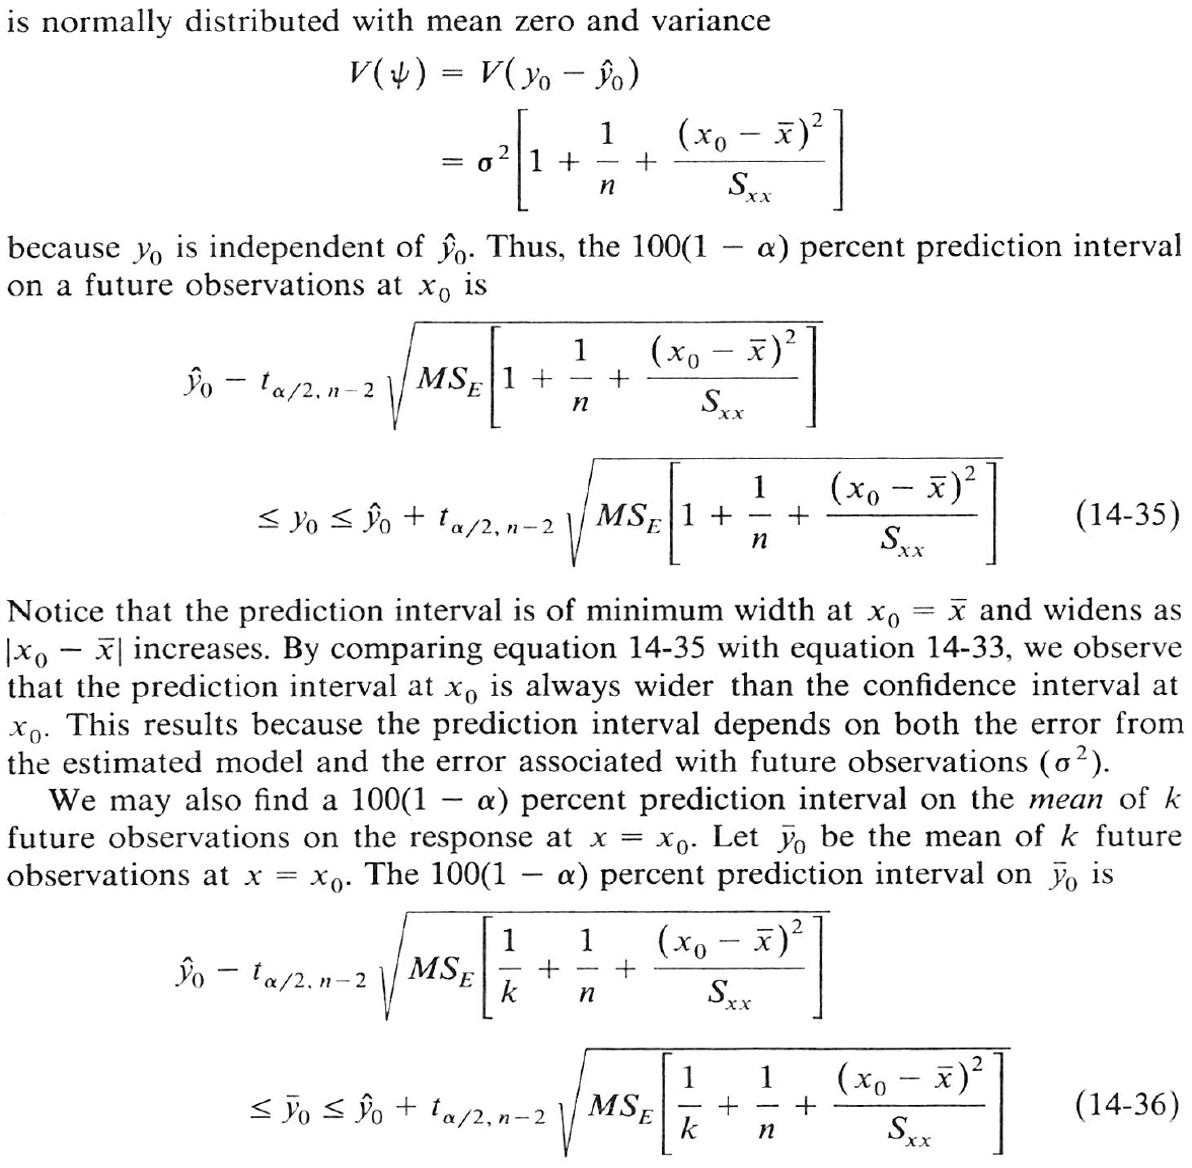


For the data given below plot and provide the requested answers. Make predictions ranges at a temperature of 190 of both an individual value and of averages of groups of 3 values. Are there any residuals that you would eliminate? What percentage of the yield per 100 units is accounted for by the temperature? (use a = 0.05)Also, the upper 90% confidence limit of the slope is normally distributed with mean zero and variance Vb\" = V()'0 _ e) 02|:1+.1_+_(__J:9i):| n S XX because yo is independent of 3%. Thus, the 100(1 a) percent prediction interval on a future observations at x0 is 1+-+ n S XX A 1 (x0 "" f 2 Syn Syn + 'a/z.n~2 M35 1 + '5 + S__ (14'35) Notice that the prediction interval is of minimum width at x0 = X and widens as |x0 - fl increases. By comparing equation 1435 with equation 14-33, we observe that the prediction interval at x0 is always wider than the condence interval at x0. This results because the prediction interval depends on both the error from the estimated model and the error associated with future observations (02). We may also nd a 1000 a) percent prediction interval on the mean of k future observations on the response at x = x0. Let in be the mean of k future observations at x = x0. The 100(1 a) percent prediction interval on J70 is )30 tat/ZJiZ MSE 1 (xoser]
Step by Step Solution
There are 3 Steps involved in it

Get step-by-step solutions from verified subject matter experts