Question: For the data in the Excel file Gasoline Prices, do the following: a. Develop a spreadsheet for forecasting prices using a simple three-period moving average.
For the data in the Excel file Gasoline Prices, do the following: a. Develop a spreadsheet for forecasting prices using a simple three-period moving average. b. Compute MAD, MSE, and MAPE error measures.
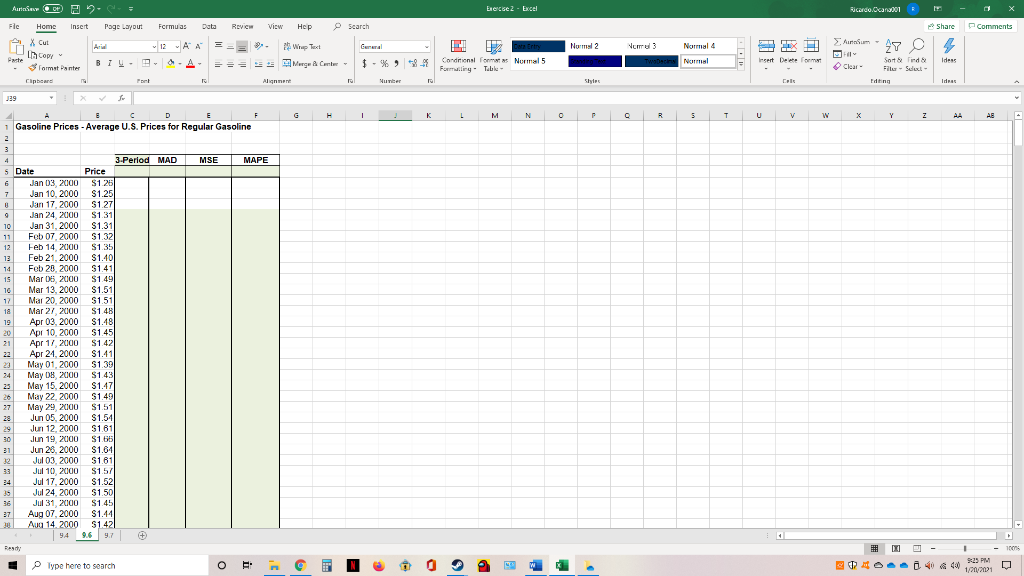
Aurinn De Exercise 2 - Excel Ricardo.cana01 Fle Page Layout Formula Data Review View Hep Search Share Comments Insert Home X Cut X Copy 3 Format Panter 12 AA Geral Wrap Text Annum - Normal 2 BIX Nurmes Normal 4 Twee Normal 27 O 4 2 Conditional Forms Normal 5 Formwiling Toll Parte B1- A- * Merge Cele Insert Delete for Ideas Clear Sortida Fit-Set Clipboard Fort Alignment Ideas Jag A E D F G H K M N P R 5 U v W W Y Z AE 1 Gasoline Prices - Average U.S. Prices for Regular Gasoline 2 MSE MAPE 3 4. 3.Period MAD 5 Date Price 6 Jan 03, 2000 S125 7 Jan 10, 2000 $1.25 Jan 17, 2000 S1.27 9 Jan 24, 2000 $1.31 10 Jan 31, 2000 S1.31 11 Feb 07, 2000 S1.32 12 Feb 14 2000 $1.35 13 Feb 21, 2000 $1.40 14 Feb 20, 2000 51.41 15 Mar 15 2000 $1.49 16 Mar 13, 2000 S151 17 Mai 20, 2000 $1.51 18 Mar 27, 2000 $1.48 19 Apr 03, 2000 S1.48 20 Apr 10,2000 51.45 21 Apr 17, 2000 $1.42 Apr 24, 2000 $1.41 May 01, 2000 $1.39| 24 May 08, 2000 $ $1.43 May 15, 2000 $1.47 26 May 22, 2000 51.40 27 May 29, 2000 $1.51 $ Jun 05, 2000 $1.51 29 Jun 12, 2000 S1.61 30 Jun 19, 2000 S165 31 Jun 28, 2000 $1.64 32 Jul 03, 2000 $1.61 33 Jul 10, 2000 S15/ Jul 17, 2000 $1.52 39 Jul 24, 2000 $1.50 Jul 31, 2000 $1.45 37 Aug 07. 2000 $1.44 Aug 14.2000 51.421 94 96 9.7 + no Type here to search + w 0.444 25 PM 1/21/2001