

Question: For the data in the table below: i. What do high kurtosis and skewness figures denote? ii. Free Sulphur dioxide and total Sulphur dioxide have
For the data in the table below:
i. What do high kurtosis and skewness figures denote?
ii. Free Sulphur dioxide and total Sulphur dioxide have mean, median and modes that
differ substantially from each other. What can you infer from this?
iii. By looking at the descriptive stats of the variables, identify two that may be closest to
being normally distributed. Why?
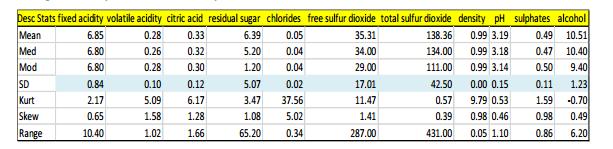
Desc Stats fixed acidity volatile acidity citric acid residual sugar chlorides free sulfur dioxide total sulfur dioxide density pH sulphates alcohol Mean 138.36 6.85 6.80 6.80 0.28 0.26 0.28 0.33 0.32 0.30 6.39 5.20 1.20 5.07 0.05 0.04 0.04 35.31 34.00 29.00 0.99 3.19 0.99 3.18 0.99 3.14 0.49 10.51 0.47 10.40 0.50 9.40 134.00 111.00 Med Mod SD 0.10 5.09 1.58 1.02 0.12 6.17 1.28 0.02 37.56 5.02 17.01. 11.47 1.41 0.11 1.23 1.59 -0.70 0.49 0.98 0.86 6.20 42.50 0.00 0.15 0.84 2.17 0.65 Kurt 3.47 1.08 0.57 9.79 0.53 0.39 0.98 0.46 Skew Range 10.40 1.66 65.20 287.00 431.00 0.05 1.10 0.34
Step by Step Solution
3.47 Rating (150 Votes )
There are 3 Steps involved in it
Certainly Lets address each part of the question i What do high kurtosis and skewness figures denote ... View full answer

Get step-by-step solutions from verified subject matter experts