

Question: For the data in the table below: i. What do the correlation coefficients of 1, shaded in yellow, indicate? ii. The highest correlation coefficient is
For the data in the table below:
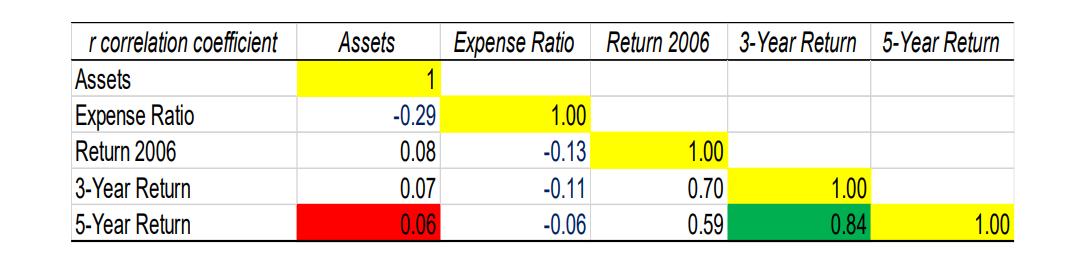
i. What do the correlation coefficients of 1, shaded in yellow, indicate?
ii. The highest correlation coefficient is 0.84, shaded in green. What can you infer from that score about the relationship between the two variables?
iii.The two lowest correlation coefficients are 0.06 and -0.06. What can you infer from that score about the relationship between the two variables?
Answer in 1200 words with a proper introduction on the topic, Concepts, and Application and conclusion for the question.
r correlation coefficient Assets Expense Ratio Return 2006 3-Year Return 5-Year Return Assets 1 1.00 Expense Ratio Return 2006 -0.29 1.00 0.70 0.59 0.08 -0.13 3-Year Return 5-Year Return 0.07 0.06 1.00 0.84 -0.11 -0.06 1.00
Step by Step Solution
3.42 Rating (158 Votes )
There are 3 Steps involved in it
Introduction Understanding correlation coefficients is crucial in statistical analyses particularly in financial contexts These coefficients measure the strength and direction of a linear relationship ... View full answer

Get step-by-step solutions from verified subject matter experts