

Question: For the data plotted in the scatterplot, the r 2 value was calculated to be 0.9846. Yearly Income vs. Age oooooooooooo oooooooooooo ooaooooooooo 15 20

For the data plotted in the scatterplot, ther2value was calculated to be 0.9846.
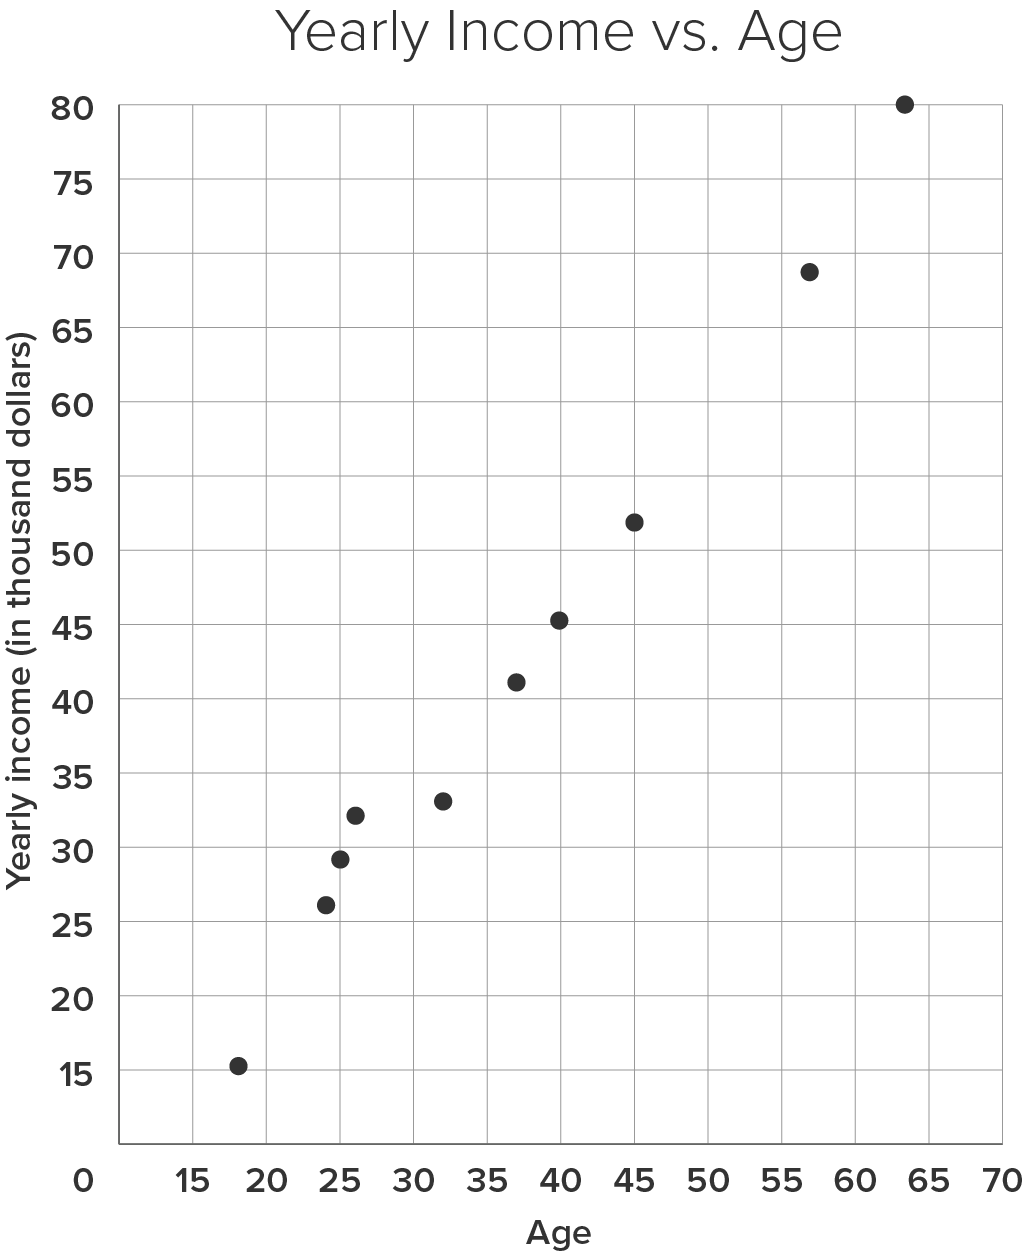
Yearly Income vs. Age oooooooooooo oooooooooooo ooaooooooooo 15 20 25 30 35 40 45 50 55 60 65 70
Step by Step Solution
There are 3 Steps involved in it
1 Expert Approved Answer
Step: 1 Unlock

Question Has Been Solved by an Expert!
Get step-by-step solutions from verified subject matter experts
Step: 2 Unlock
Step: 3 Unlock