

Question: For the data set shown by the table, a. Create a scatter plot for the data. b. Use the scatter plot to determine whether
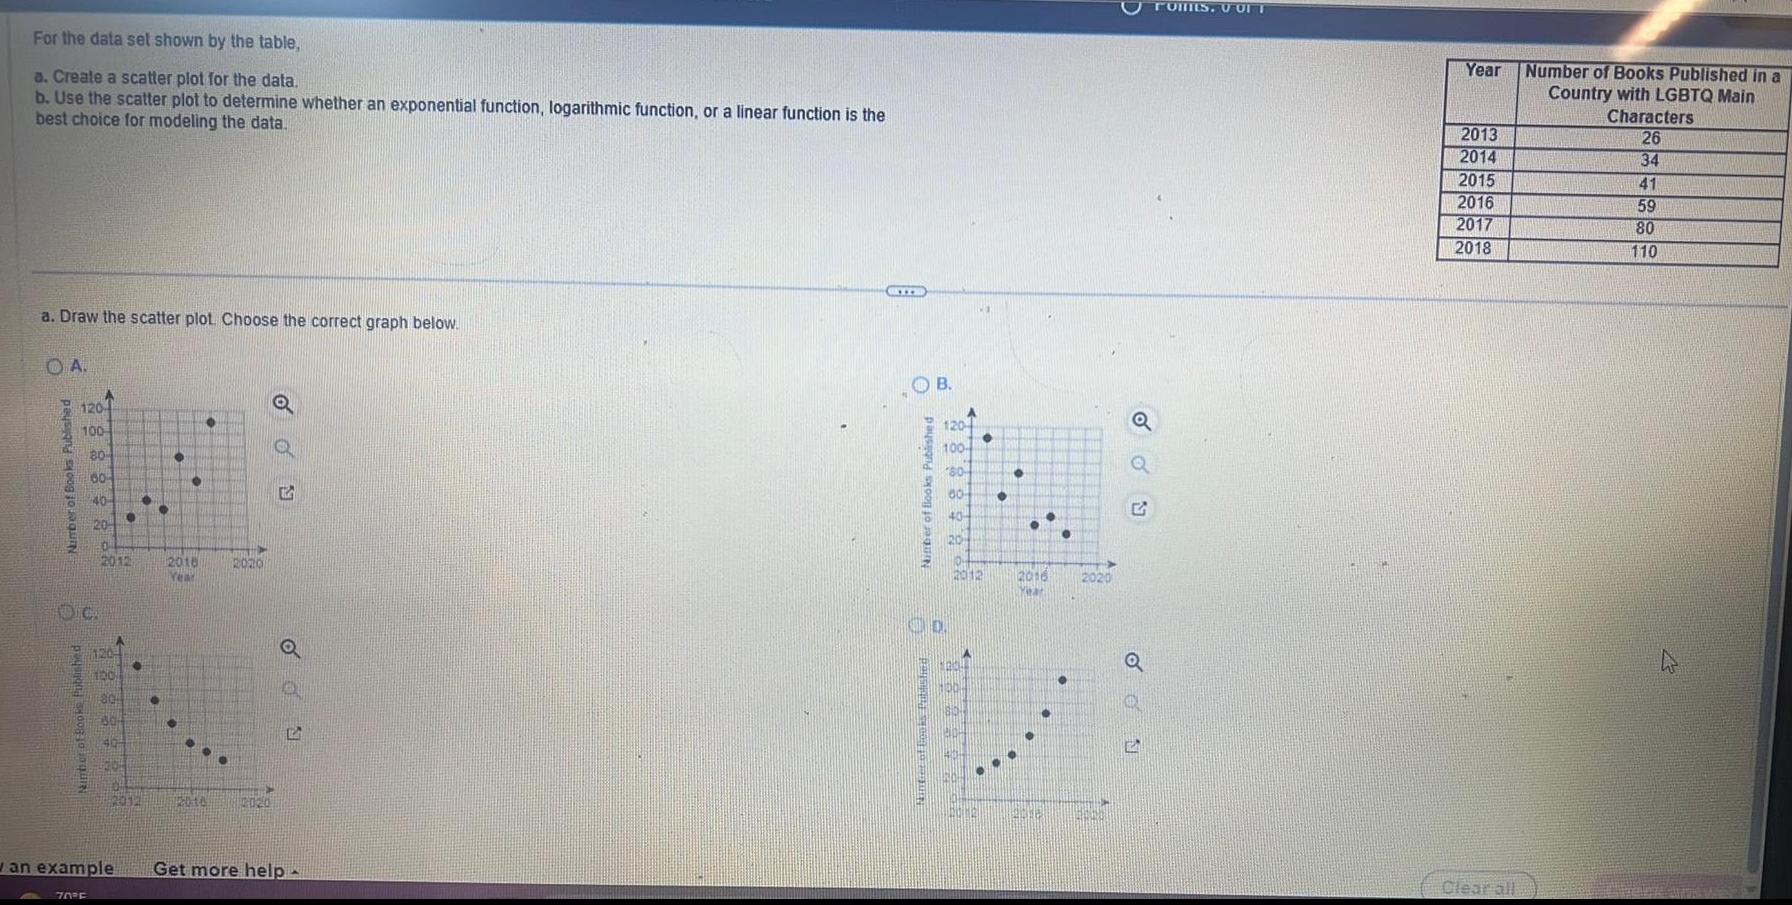
For the data set shown by the table, a. Create a scatter plot for the data. b. Use the scatter plot to determine whether an exponential function, logarithmic function, or a linear function is the best choice for modeling the data. a. Draw the scatter plot. Choose the correct graph below. O.A. Number of Books Published A 120- 100- 80- 00- 40- 20 10 2012 2018 2020 Nimber of Books Published 120- 100 Year 2012 1201 2020 o wan example Get more help 70F Nimber o er of Books Published B. 120 100- 80 00- 40- 20 10 TOILS. UUIT a G 2012 2016 2020 Year Year Number of Books Published in a Country with LGBTQ Main Characters 2013 26 2014 34 2015 41 2016 59 2017 80 2018 110 Clear all K
Step by Step Solution
There are 3 Steps involved in it

Get step-by-step solutions from verified subject matter experts