

Question: X Course Home X P Test 3: Chapter 4 (32 question X + arson.com/Student/PlayerTest.aspx?testid=249731483¢erwin=yes # O Spring 23, termC maybis castro 03/23/2 apter 4 (32
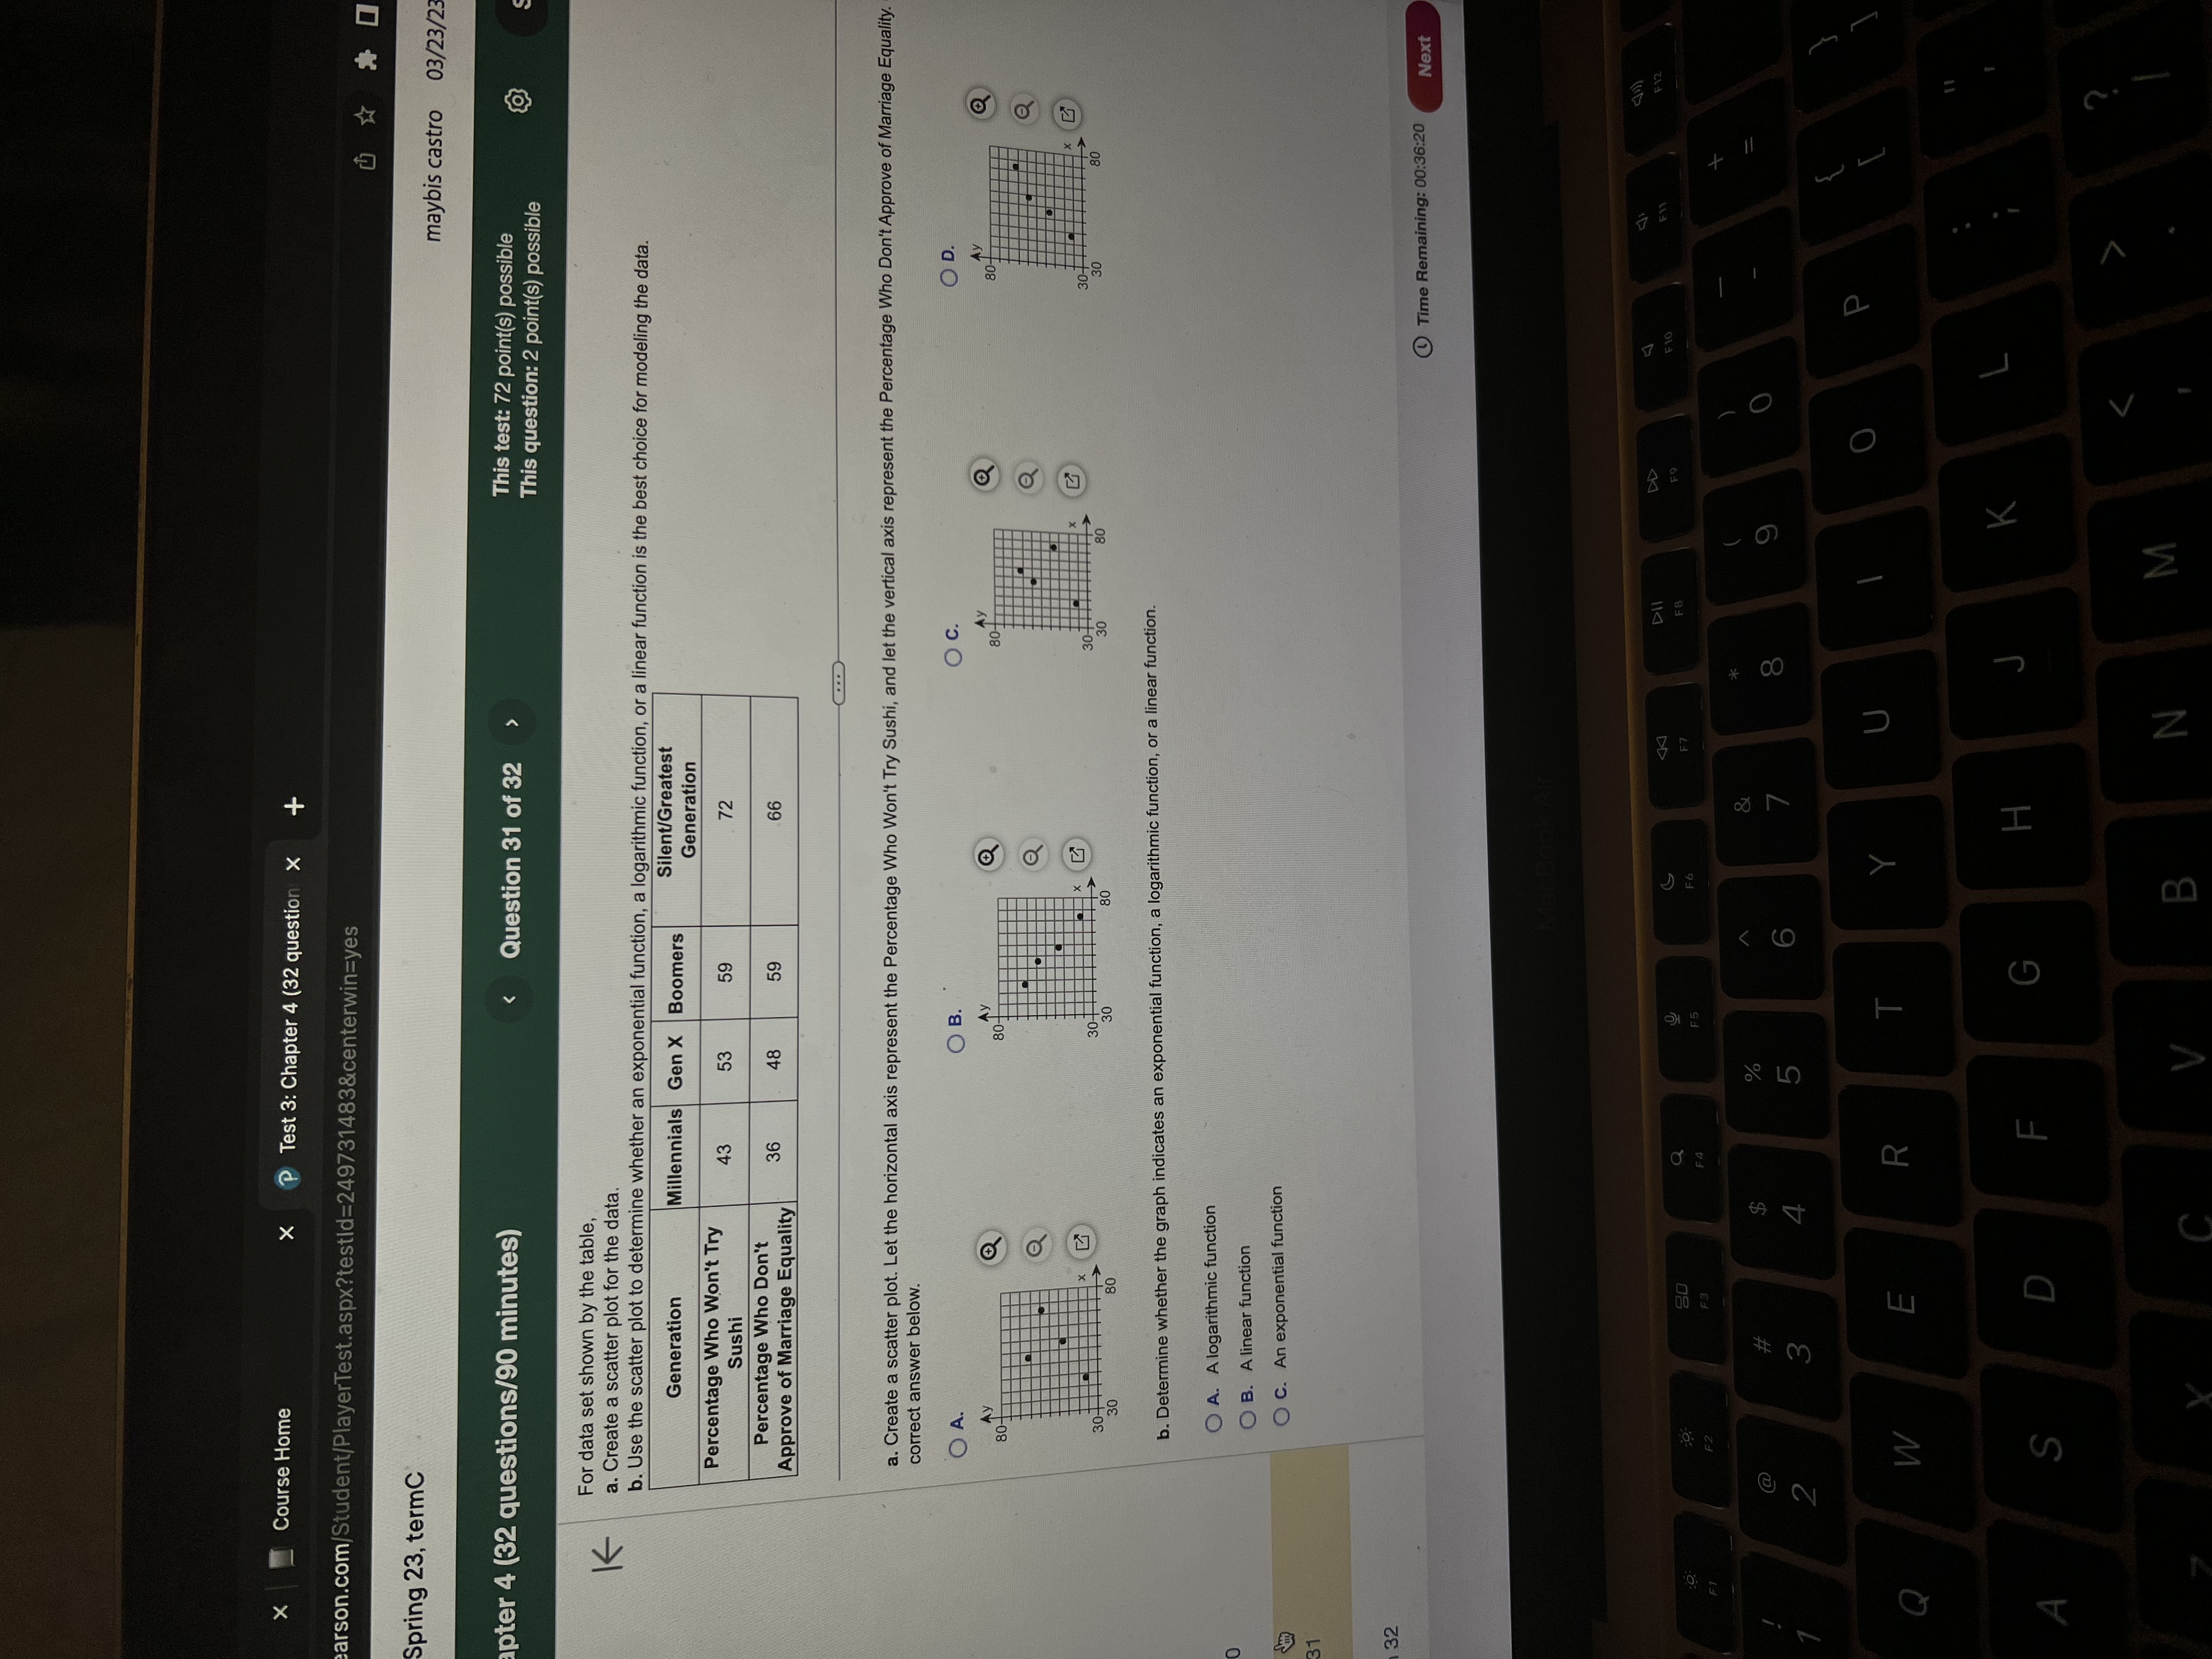
X Course Home X P Test 3: Chapter 4 (32 question X + arson.com/Student/PlayerTest.aspx?testid=249731483¢erwin=yes # O Spring 23, termC maybis castro 03/23/2 apter 4 (32 questions/90 minutes) Question 31 of 32 This test: 72 point(s) possible This question: 2 point(s) possible K For data set shown by the table, . Create a scatter plot for the data. . Use the scatter plot to determine whether an exponential function, a logarithmic function, or a linear function is the best choice for modeling the data. Generation Millennials Gen X Boomers Silent/Greatest Generation Percentage Who Won't Try 43 Sushi 53 59 72 Percentage Who Don't 36 Approve of Marriage Equality 48 59 66 a. Create a scatter plot. Let the horizontal axis represent the Percentage Who Won't Try Sushi, and let the vertical axis represent the Percentage Who Don't Approve of Marriage Equality. correct answer below. OA. OB. O C. OD. Ay 80 30- X OHH 30 80 20 80 b. Determine whether the graph indicates an exponential function, a logarithmic function, or a linear function. O A. A logarithmic function O B. A linear function O C. An exponential function 32 Time Remaining: 00:36:20 Next F12 FB E3 @ 5 P U E R T Y O W G H K 14 S D V B N M
Step by Step Solution
There are 3 Steps involved in it

Get step-by-step solutions from verified subject matter experts