

Question: For the data shown in the following Table A, show the first two iterations using a genetic algorithm in trying to find the optimum membership
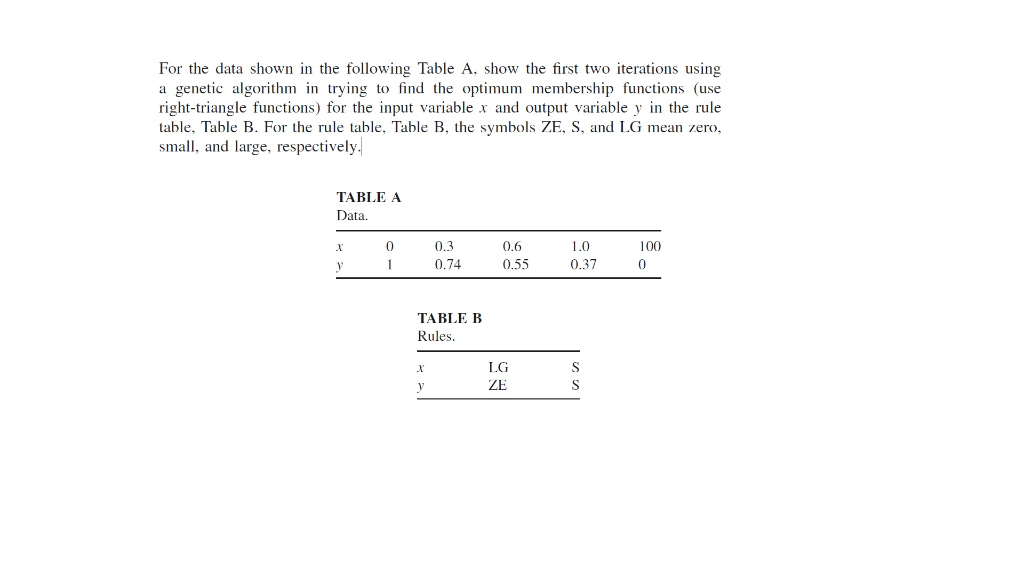
For the data shown in the following Table A, show the first two iterations using a genetic algorithm in trying to find the optimum membership functions (use right-triangle functions) for the input variable x and output variable y in the rule table, Table B. For the rule table, Table B, the symbols ZE, S, and LG mean zero, small, and large, respectively. TABLE A Data. 0 1 0.3 0.74 0.6 0.55 1.0 0.37 100 0 TABLE B Rules. X LGS y ZES For the data shown in the following Table A, show the first two iterations using a genetic algorithm in trying to find the optimum membership functions (use right-triangle functions) for the input variable x and output variable y in the rule table, Table B. For the rule table, Table B, the symbols ZE, S, and LG mean zero, small, and large, respectively. TABLE A Data. 0 1 0.3 0.74 0.6 0.55 1.0 0.37 100 0 TABLE B Rules. X LGS y ZES
Step by Step Solution
There are 3 Steps involved in it

Get step-by-step solutions from verified subject matter experts