

Question: For the following data (a) display the data in a scatter plot, (b) calculate the correlation coefficient r, and (c) make a conclusion about the
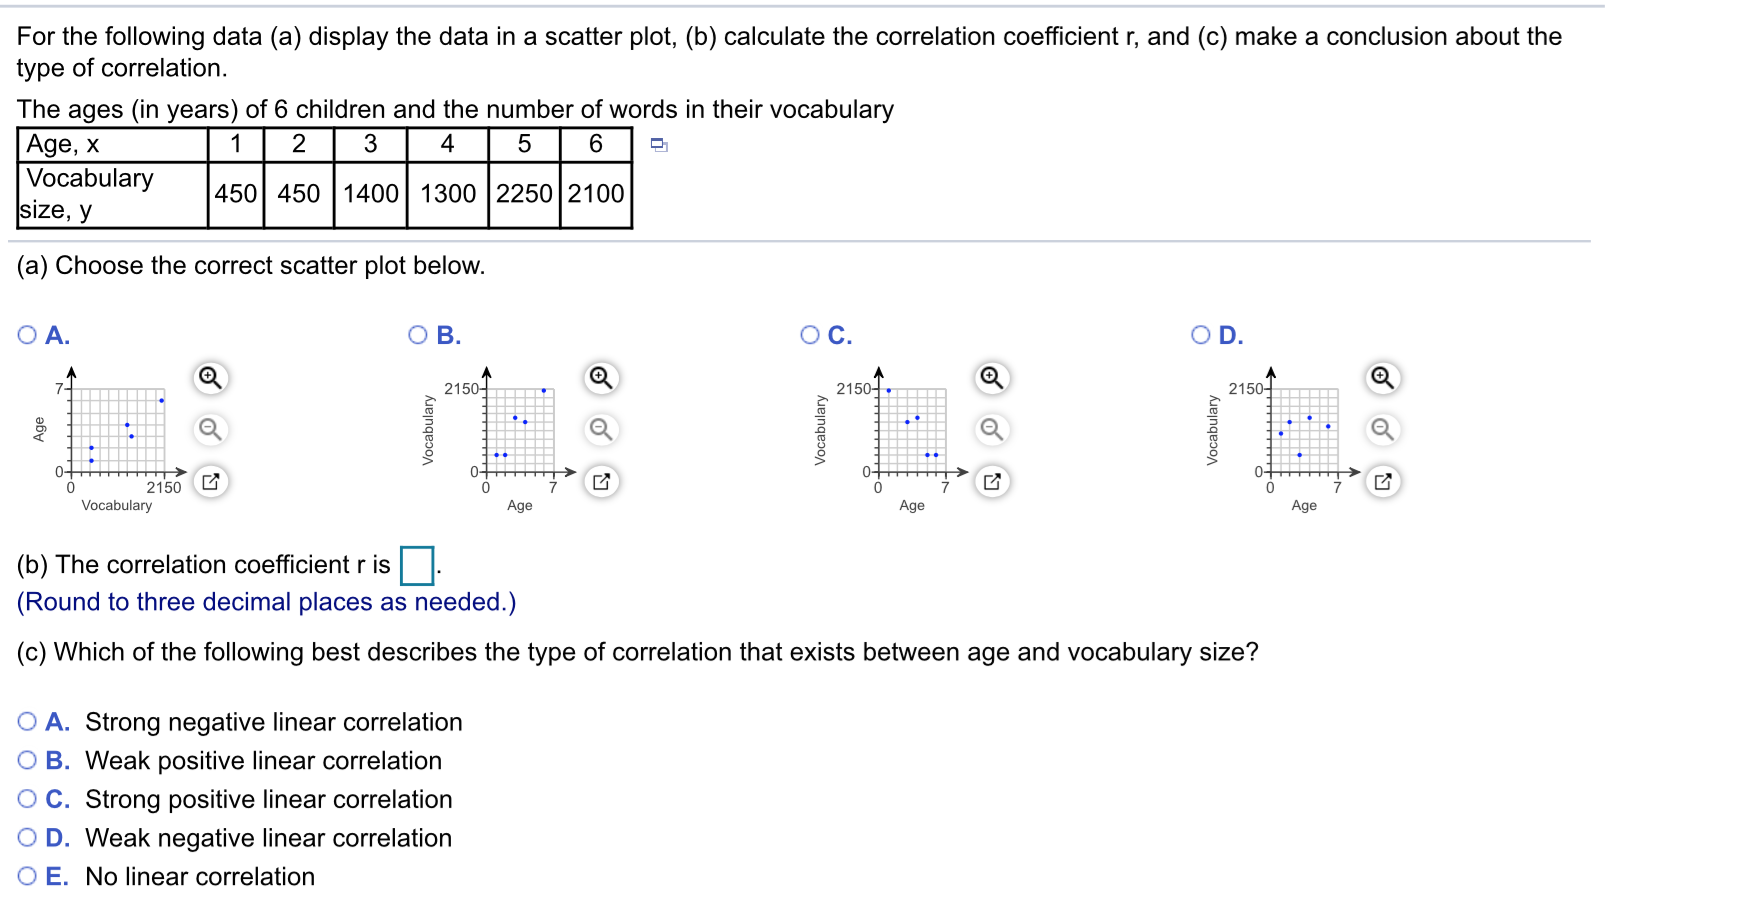
For the following data (a) display the data in a scatter plot, (b) calculate the correlation coefficient r, and (c) make a conclusion about the type of correlation. The ages (in years) of 6 children and the number of words in their vocabulary Age, x 3 4 Vocabulary size, y 450 450 1400 1300 2250 2100 (a) Choose the correct scatter plot below OA. OB. OC. OD. O O 2150- 2150- O 2150- O Age O Vocabulary Vocabulary Vocabulary 0+ 0+ 0+ Vocabulary Age Age Age (b) The correlation coefficient r is (Round to three decimal places as needed.) (c) Which of the following best describes the type of correlation that exists between age and vocabulary size? O A. Strong negative linear correlation O B. Weak positive linear correlation O C. Strong positive linear correlation O D. Weak negative linear correlation O E. No linear correlation
Step by Step Solution
There are 3 Steps involved in it

Get step-by-step solutions from verified subject matter experts