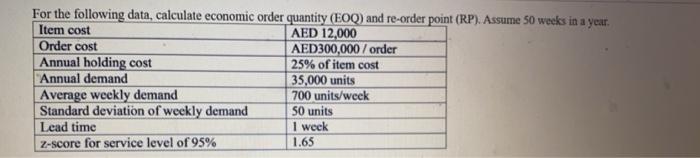
Question: For the following data, calculate economic order quantity (EOQ) and re-order point (RP). Assume 50 weeks in a year. Item cost AED 12,000 Order cost

For the following data, calculate economic order
For the following data, calculate economic order quantity (EOQ) and re-order point (RP). Assume 50 weeks in a year. Item cost AED 12,000 Order cost AED 300,000 / order Annual holding cost 25% of item cost Annual demand 35,000 units Average weekly demand 700 units/week Standard deviation of weekly demand SO units Lead time 1 weck Z-score for service level of 95% 1.65 A specific forecasting model was used to forecast demand for a product. The forecasts and the corresponding demand that subsequently occurred are shows follows. Use the MAD, MSE and MAPE to evaluate the accuracy of the forecasting model Months Actual Forecast October 700 660 November 760 840 December 780 750 January 790 835 February 850 910 March 950 890

Step by Step Solution

There are 3 Steps involved in it

1 Expert Approved Answer
Step: 1 Unlock blur-text-image
Question Has Been Solved by an Expert!

Get step-by-step solutions from verified subject matter experts

Step: 2 Unlock
Step: 3 Unlock

Students Have Also Explored These Related General Management Questions!