

Question: For the following data: (Ordered) A) Calculate 1) the average or average 2) the median (Q2) 3) fashion 4) Q1 5) Q3 6) the range
For the following data: (Ordered)
A) Calculate
1) the average or average
2) the median (Q2)
3) fashion
4) Q1
5) Q3
6) the range
7) the interquartil range
8) the variance
9) the standard deviation
10) the coefficient of variation
b) Prepare Box Plot (Box and Wisker)
C) Determine the values of the border or near the atypical numbers
(Outliers)
D) Answer whether or not there are atypical numbers. If there are any, what are they?
E) Determine how many standard deviations the number 40 of your Average.
F) If the standard deviation had to be estimated, what would be your estimate?
G) According to Tchevyshev's Theorem, at least 75% of the data must be among which pair of values must be.
H) Perform and Draw a Relative Frequency Diagram. Use 5 Classes
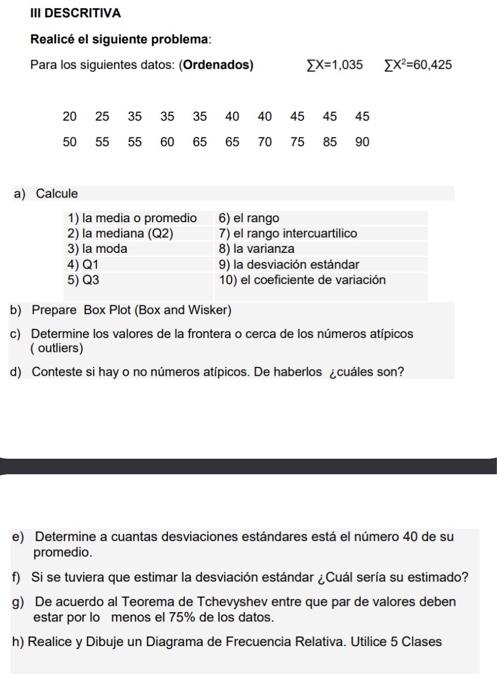
III DESCRITIVA Realic el siguiente problema: Para los siguientes datos: (Ordenados) X=1,035X2=60,425 b) Prepare Box Plot (Box and Wisker) c) Determine los valores de la frontera o cerca de los nmeros atpicos (outliers) d) Conteste si hay o no nmeros atpicos. De haberlos cules son? e) Determine a cuantas desviaciones estndares est el nmero 40 de su promedio. f) Si se tuviera que estimar la desviacin estndar Cul sera su estimado? g) De acuerdo al Teorema de Tchevyshev entre que par de valores deben estar por lo menos el 75% de los datos. h) Realice y Dibuje un Diagrama de Frecuencia Relativa. Utilice 5 Clases
Step by Step Solution
There are 3 Steps involved in it
1 Expert Approved Answer
Step: 1 Unlock

Question Has Been Solved by an Expert!
Get step-by-step solutions from verified subject matter experts
Step: 2 Unlock
Step: 3 Unlock