

Question: help with this please. Paragraph | Statistics Island Directions For all calculations, show your work and/or explain how you used the calculator to compute. 1.

help with this please.
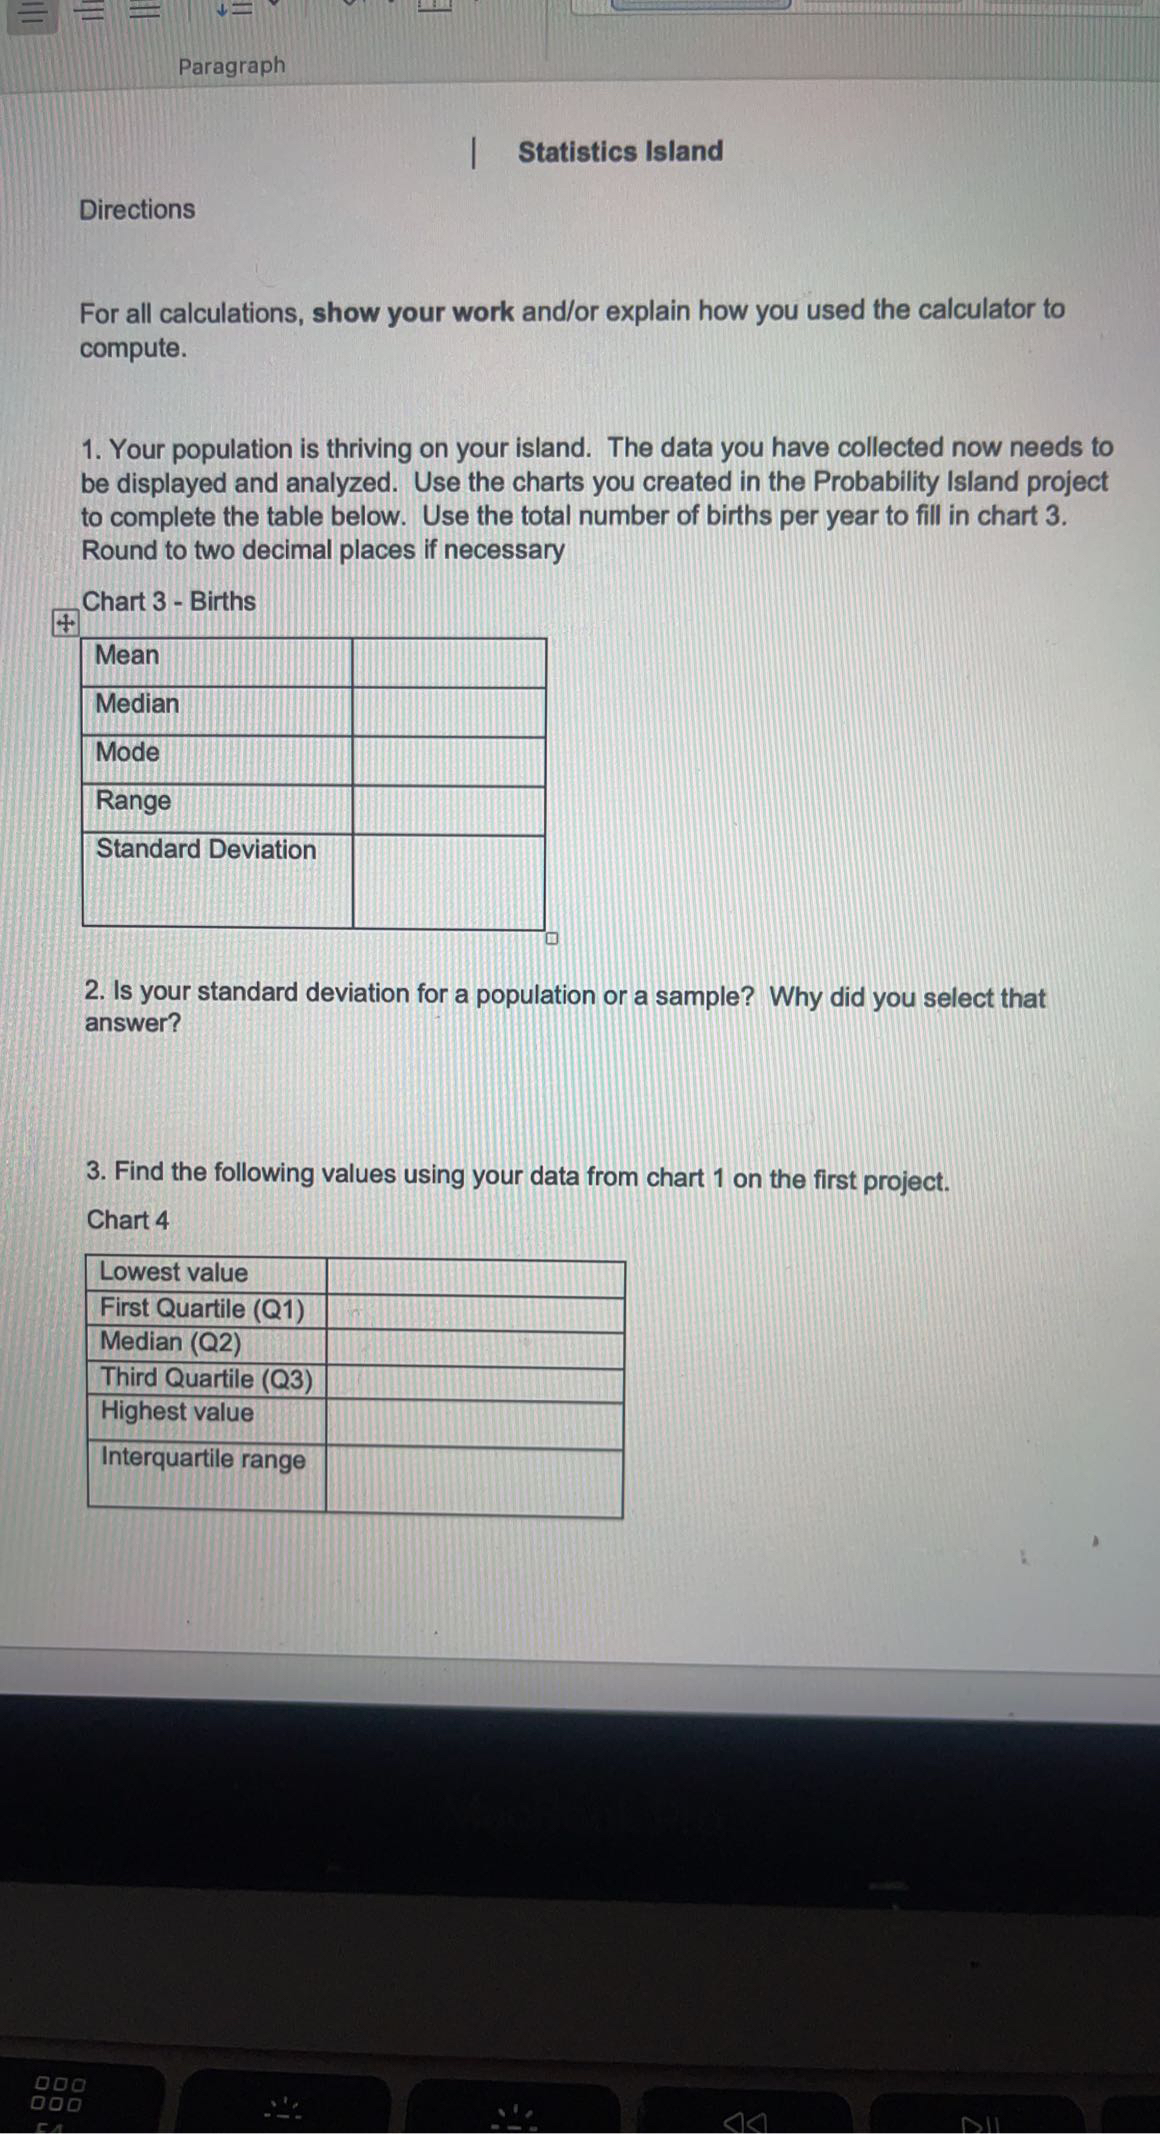
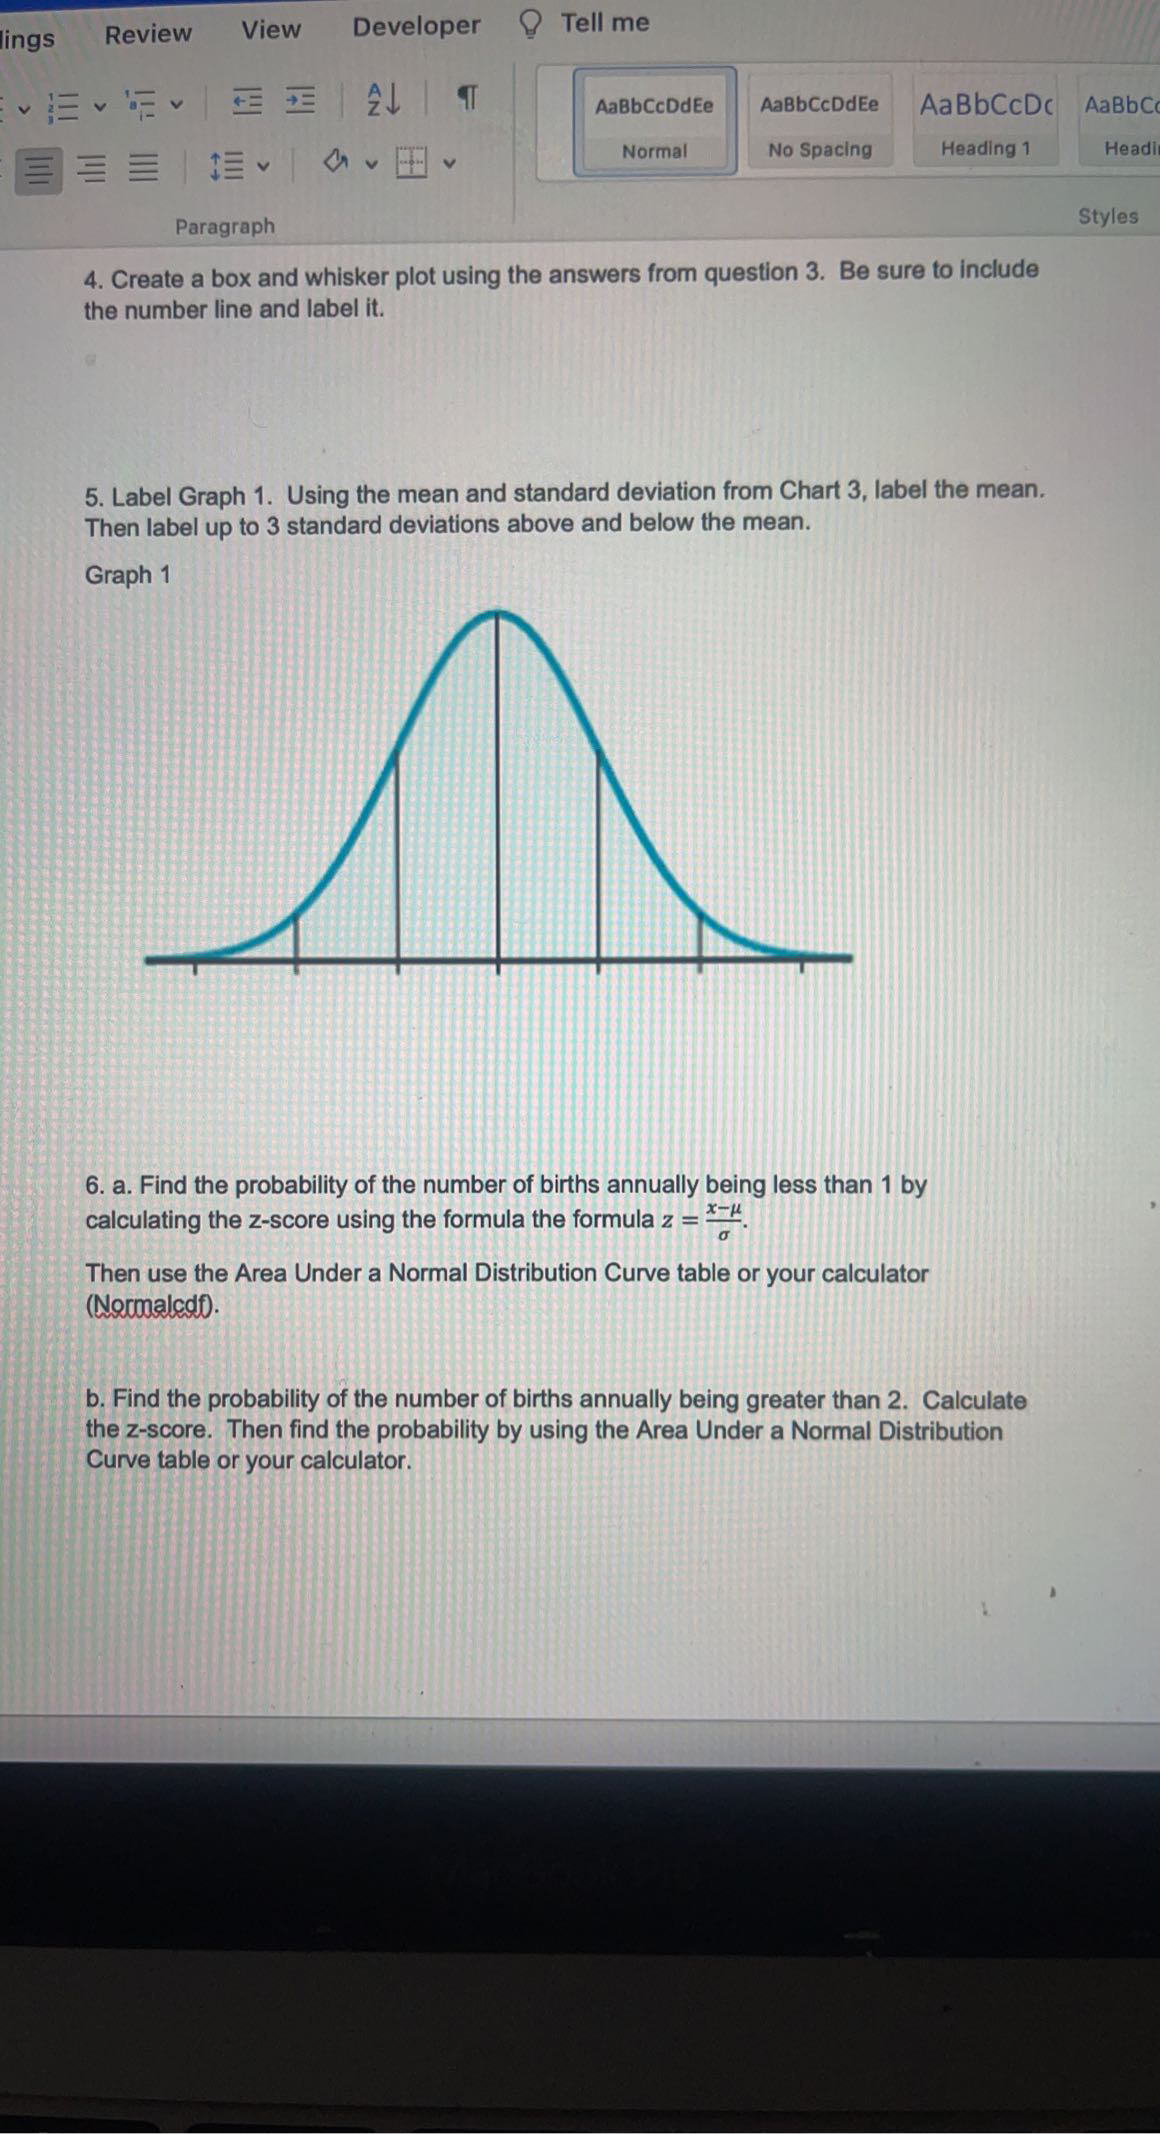
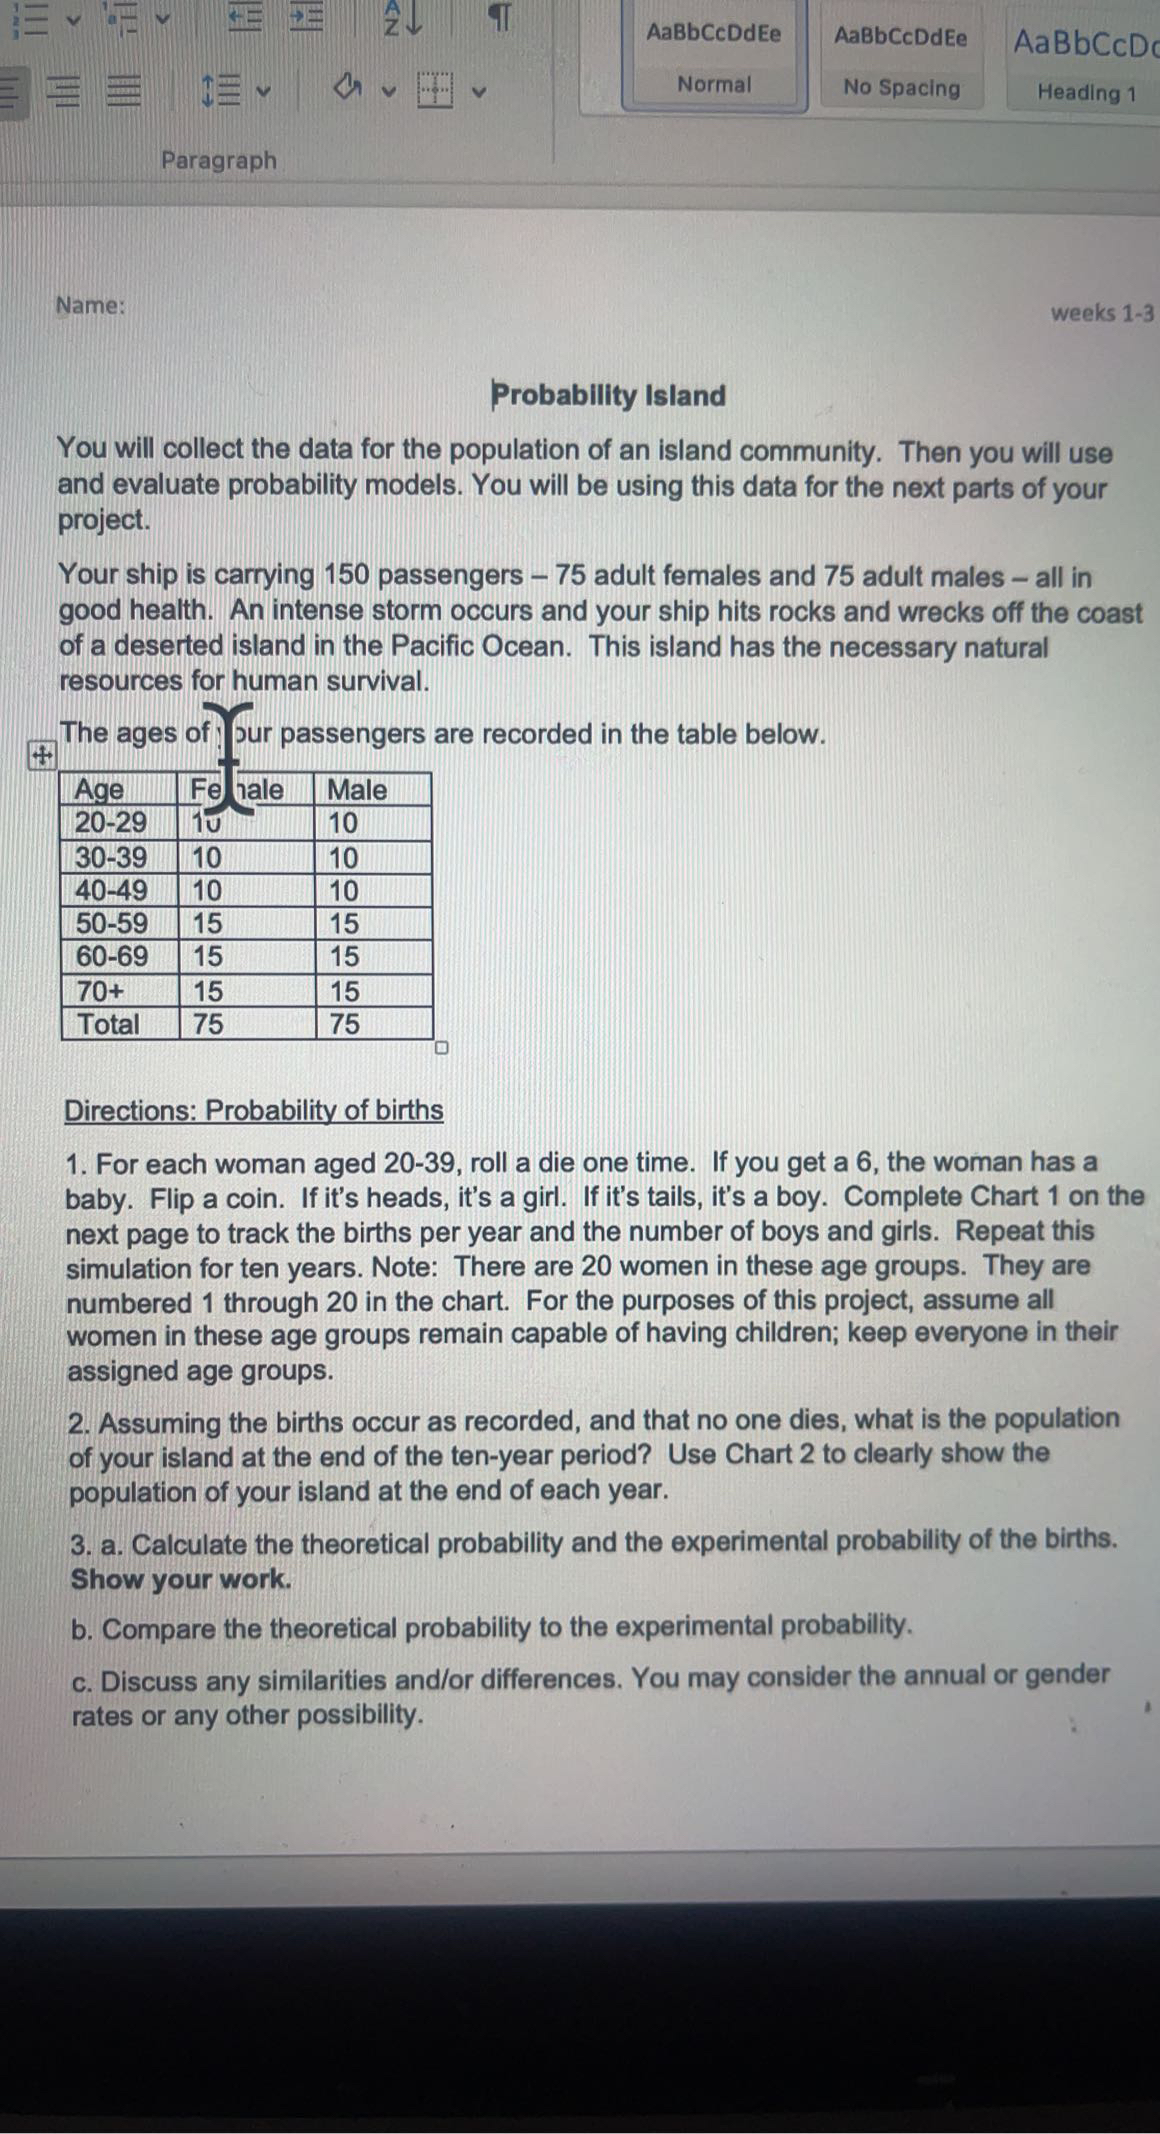
Paragraph | Statistics Island Directions For all calculations, show your work and/or explain how you used the calculator to compute. 1. Your population is thriving on your island. The data you have collected now needs to be displayed and analyzed. Use the charts you created in the Probability Island project to complete the table below. Use the total number of births per year to fill in chart 3. Round to two decimal places if necessary Chart 3 - Births Mean Median Mode Range Standard Deviation 2. Is your standard deviation for a population or a sample? Why did you select that answer? 3. Find the following values using your data from chart 1 on the first project. Chart 4 Lowest value First Quartile (Q1) Median (Q2) Third Quartile (Q3) Highest value Interquartile range 000lings Review View Developer Tell me 2- v O AaBbCcDdEe AaBbCcDdEe Aa BbCcDc AaBbC E Normal No Spacing Heading 1 Head Paragraph Styles 4. Create a box and whisker plot using the answers from question 3. Be sure to include the number line and label it. 5. Label Graph 1. Using the mean and standard deviation from Chart 3, label the mean. Then label up to 3 standard deviations above and below the mean. Graph 1 6. a. Find the probability of the number of births annually being less than 1 by calculating the z-score using the formula the formula 2 - *= Then use the Area Under a Normal Distribution Curve table or your calculator (Normalcat. b. Find the probability of the number of births annually being greater than 2. Calculate the z-score. Then find the probability by using the Area Under a Normal Distribution Curve table or your calculator.AaBbCcDdEe AaBbCcDdEe AaBbCcD V . Normal No Spacing Heading 1 Paragraph Name: weeks 1-3 Probability Island You will collect the data for the population of an island community. Then you will use and evaluate probability models. You will be using this data for the next parts of your project. Your ship is carrying 150 passengers - 75 adult females and 75 adult males - all in good health. An intense storm occurs and your ship hits rocks and wrecks off the coast of a deserted island in the Pacific Ocean. This island has the necessary natural resources for human survival. The ages of our passengers are recorded in the table below. Age Fe male |Male 20-29 10 30-39 10 10 40-49 10 10 50-59 15 15 60-69 15 15 70+ 15 15 Total 75 75 Directions: Probability of births 1. For each woman aged 20-39, roll a die one time. If you get a 6, the woman has a baby. Flip a coin. If it's heads, it's a girl. If it's tails, it's a boy. Complete Chart 1 on the next page to track the births per year and the number of boys and girls. Repeat this simulation for ten years. Note: There are 20 women in these age groups. They are numbered 1 through 20 in the chart. For the purposes of this project, assume all women in these age groups remain capable of having children; keep everyone in their assigned age groups. 2. Assuming the births occur as recorded, and that no one dies, what is the population of your island at the end of the ten-year period? Use Chart 2 to clearly show the population of your island at the end of each year. 3. a. Calculate the theoretical probability and the experimental probability of the births. Show your work. b. Compare the theoretical probability to the experimental probability. c. Discuss any similarities and/or differences. You may consider the annual or gender rates or any other possibility
Step by Step Solution
There are 3 Steps involved in it

Get step-by-step solutions from verified subject matter experts