

Question: For the following, first write a script that calculates y and z for the three values of x then prints out the values. Next, plot
For the following, first write a script that calculates y and z for the three values of x then prints out the values. Next, plot y and z versus ts in one figure. First, repeat the problem 4 (equations for y and z), only this time use array operations in order to do all three values of x at once. Attachment below for problem 4
Next were going to create a plot of the equations for y and z. Create a new variable ts that has 30 elements and goes from 1 to 10o Which array creation command should you use? Create ys and zs variables which calculate the equations for all of the ts values(use the same equations as before but replace x with ts). Now add a plot command to plot both ys and zs on the same grapho reminder 1) plot(xs,ys,r) plots xs versus ys in red (b does blue)o reminder 2) hold on keeps MATLAB from overwriting the previous plot o reminder 3) clf clears the figure
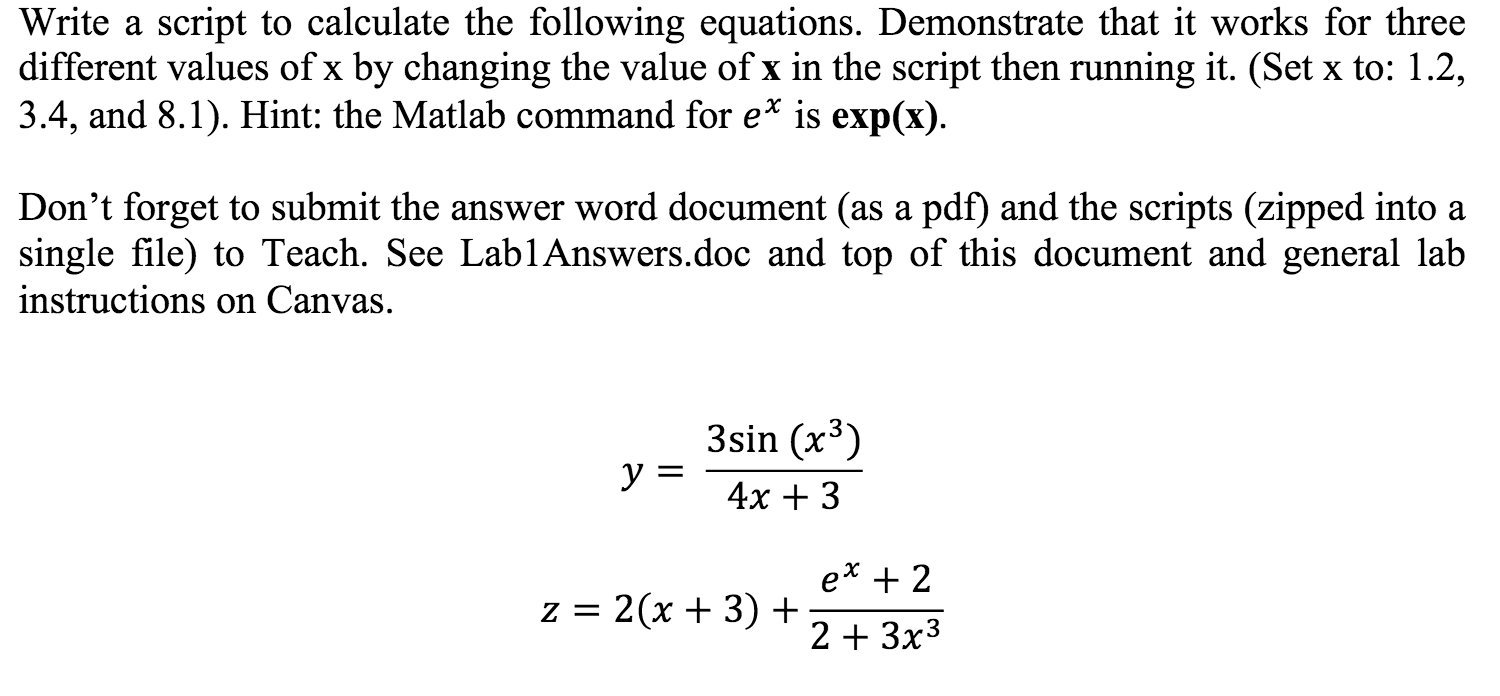
Write a script to calculate the following equations. Demonstrate that it works for three different values of x by changing the value of x in the script then running it. (Set x to: 1.2, 3.4, and 8.1). Hint: the Matlab command for e* is exp(x) Don't forget to submit the answer word document (as a pdf) and the scripts (zipped into:a single file) to Teach. See LablAnswers.doc and top of this document and general lalb instructions on Canvas. 3sin (x3) 4x + 3 23x3
Step by Step Solution
There are 3 Steps involved in it

Get step-by-step solutions from verified subject matter experts