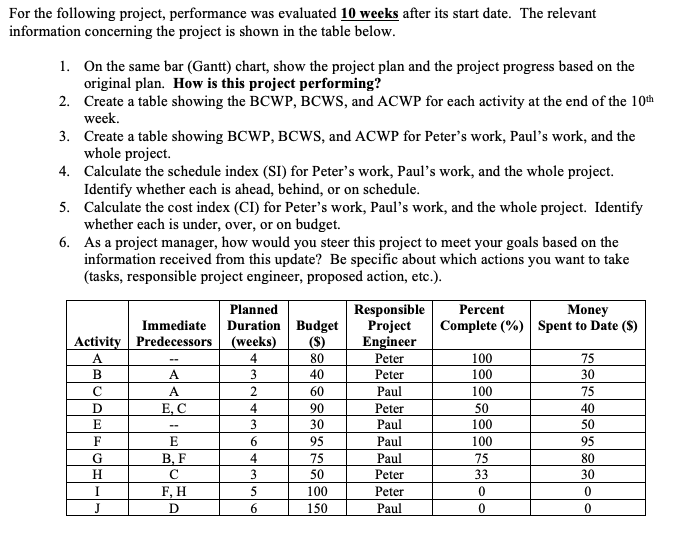
Question: For the following project, performance was evaluated 10 weeks after its start date. The relevant information concerning the project is shown in the table below.

For the following project, performance was

For the following project, performance was evaluated 10 weeks after its start date. The relevant information concerning the project is shown in the table below. 1. On the same bar (Gantt) chart, show the project plan and the project progress based on the original plan. How is this project performing? 2. Create a table showing the BCWP, BCWS, and ACWP for each activity at the end of the 10th week. 3. Create a table showing BCWP, BCWS, and ACWP for Peter's work, Paul's work, and the whole project. 4. Calculate the schedule index (SI) for Peter's work, Paul's work, and the whole project. Identify whether each is ahead, behind, or on schedule. 5. Calculate the cost index (CI) for Peter's work, Paul's work, and the whole project. Identify whether each is under, over, or on budget. 6. As a project manager, how would you steer this project to meet your goals based on the information received from this update? Be specific about which actions you want to take (tasks, responsible project engineer, proposed action, etc.). Planned Responsible Percent Money Immediate Duration Budget Project Complete (%) Spent to Date (s) Activity Predecessors (weeks) Engineer Peter 75 3 40 Paul EC Paul Paul BF Paul 4 80 Peter A B D E A A Peter 2 4 3 6 4 3 5 6 E 100 100 100 50 100 100 75 33 0 0 60 90 30 95 75 50 100 150 30 75 40 50 95 80 30 0 0 G H I F, H Peter Peter Paul D

Step by Step Solution

There are 3 Steps involved in it

1 Expert Approved Answer
Step: 1 Unlock blur-text-image
Question Has Been Solved by an Expert!

Get step-by-step solutions from verified subject matter experts

Step: 2 Unlock
Step: 3 Unlock

Students Have Also Explored These Related General Management Questions!