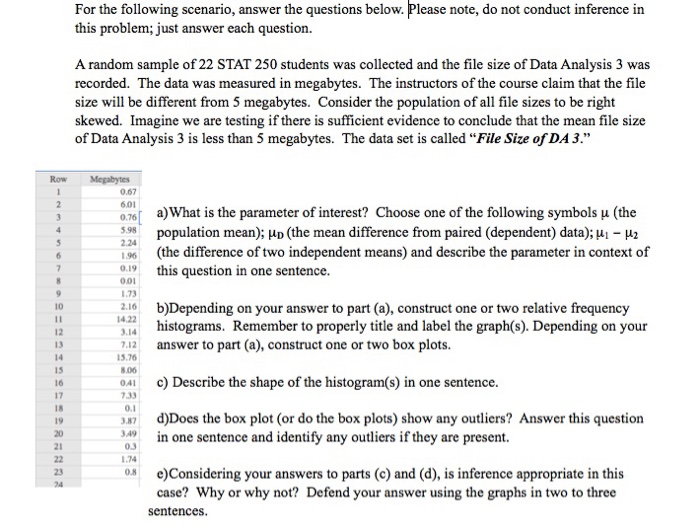
Question: For the following scenario, answer the questions below. Please note, do not conduct inference in this problem; just answer each question. A random sample of

For the following scenario, answer the questions
For the following scenario, answer the questions below. Please note, do not conduct inference in this problem; just answer each question. A random sample of 22 STAT 250 students was collected and the file size of Data Analysis 3 was recorded. The data was measured in megabytes. The instructors of the course claim that the file size will be different from 5 megabytes. Consider the population of all file sizes to be right skewed. Imagine we are testing if there is sufficient evidence to conclude that the mean file size of Data Analysis 3 is less than 5 megabytes. The data set is called "File Size of DA 3." Megabytes 0.67 6.01 5.98 2.24 1.96 0.19 0.01 a) What is the parameter of interest? Choose one of the following symbols u (the population mean); up (the mean difference from paired (dependent) data); H1 - H2 (the difference of two independent means) and describe the parameter in context of this question in one sentence. 1.73 2.16 1422 b)Depending on your answer to part (a), construct one or two relative frequency histograms. Remember to properly title and label the graph(s). Depending on your answer to part (a), construct one or two box plots. 7.12 15.76 306 041 7.33 0.1 3.87 3.49 c) Describe the shape of the histogram(s) in one sentence. d)Does the box plot (or do the box plots) show any outliers? Answer this question in one sentence and identify any outliers if they are present. e)Considering your answers to parts (c) and (d), is inference appropriate in this case? Why or why not? Defend your answer using the graphs in two to three sentences. For the following scenario, answer the questions below. Please note, do not conduct inference in this problem; just answer each question. A random sample of 22 STAT 250 students was collected and the file size of Data Analysis 3 was recorded. The data was measured in megabytes. The instructors of the course claim that the file size will be different from 5 megabytes. Consider the population of all file sizes to be right skewed. Imagine we are testing if there is sufficient evidence to conclude that the mean file size of Data Analysis 3 is less than 5 megabytes. The data set is called "File Size of DA 3." Megabytes 0.67 6.01 5.98 2.24 1.96 0.19 0.01 a) What is the parameter of interest? Choose one of the following symbols u (the population mean); up (the mean difference from paired (dependent) data); H1 - H2 (the difference of two independent means) and describe the parameter in context of this question in one sentence. 1.73 2.16 1422 b)Depending on your answer to part (a), construct one or two relative frequency histograms. Remember to properly title and label the graph(s). Depending on your answer to part (a), construct one or two box plots. 7.12 15.76 306 041 7.33 0.1 3.87 3.49 c) Describe the shape of the histogram(s) in one sentence. d)Does the box plot (or do the box plots) show any outliers? Answer this question in one sentence and identify any outliers if they are present. e)Considering your answers to parts (c) and (d), is inference appropriate in this case? Why or why not? Defend your answer using the graphs in two to three sentences

Step by Step Solution

There are 3 Steps involved in it

1 Expert Approved Answer
Step: 1 Unlock blur-text-image
Question Has Been Solved by an Expert!

Get step-by-step solutions from verified subject matter experts

Step: 2 Unlock
Step: 3 Unlock

Students Have Also Explored These Related General Management Questions!