

Question: For the following signal, x(t), plot: a. x(-t+3) b. x(2t) c. x(0.5t) 2 1 x(t) 3 t
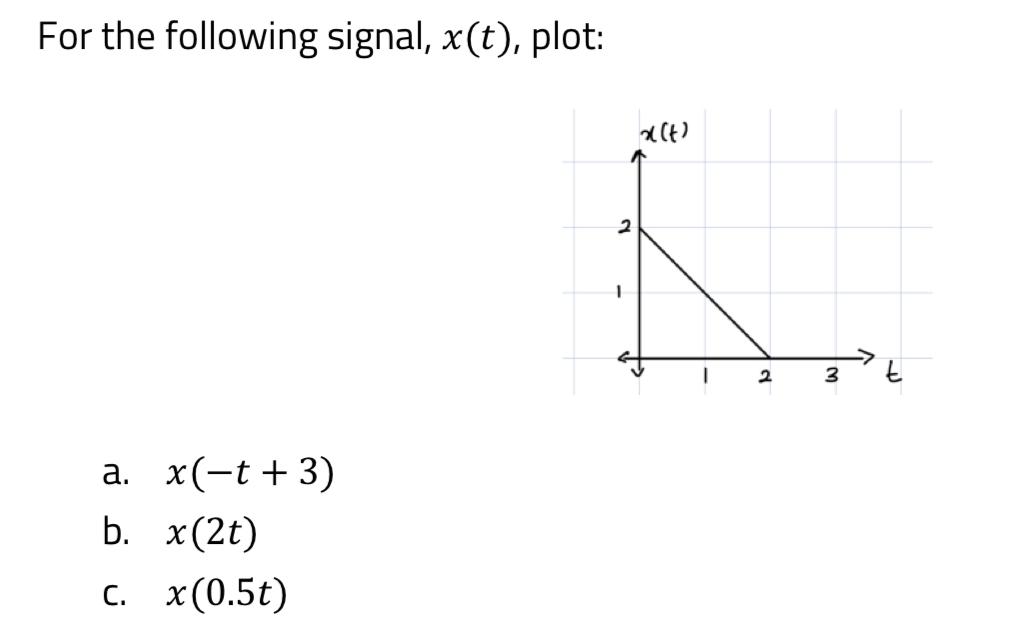
For the following signal, x(t), plot: a. x(-t+3) b. x(2t) c. x(0.5t) 2 1 x(t) 3 t
Step by Step Solution
★★★★★
3.48 Rating (158 Votes )
There are 3 Steps involved in it
1 Expert Approved Answer
Step: 1 Unlock

Question Has Been Solved by an Expert!
Get step-by-step solutions from verified subject matter experts
Step: 2 Unlock
Step: 3 Unlock